Comparative Study
. 2010 Dec 1;30(48):16249-61.
doi: 10.1523/JNEUROSCI.3357-10.2010.

Emergent dynamics of fast ripples in the epileptic hippocampus

Affiliations
Comparative Study

Emergent dynamics of fast ripples in the epileptic hippocampus

Jose M Ibarz et al. J Neurosci. .

Abstract

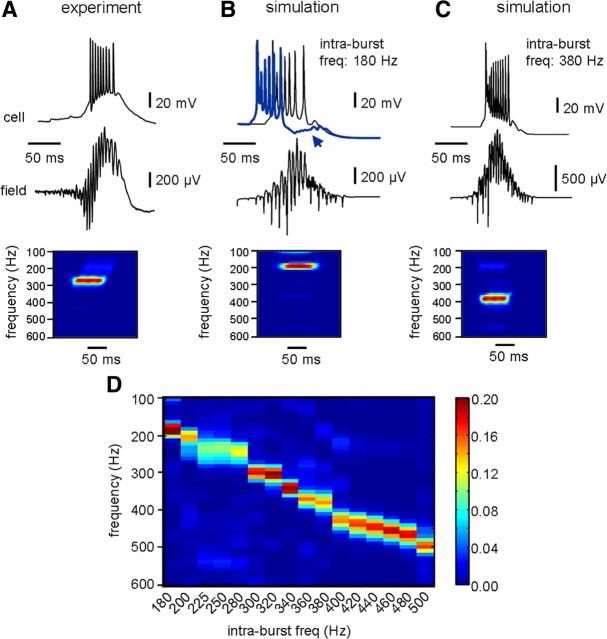
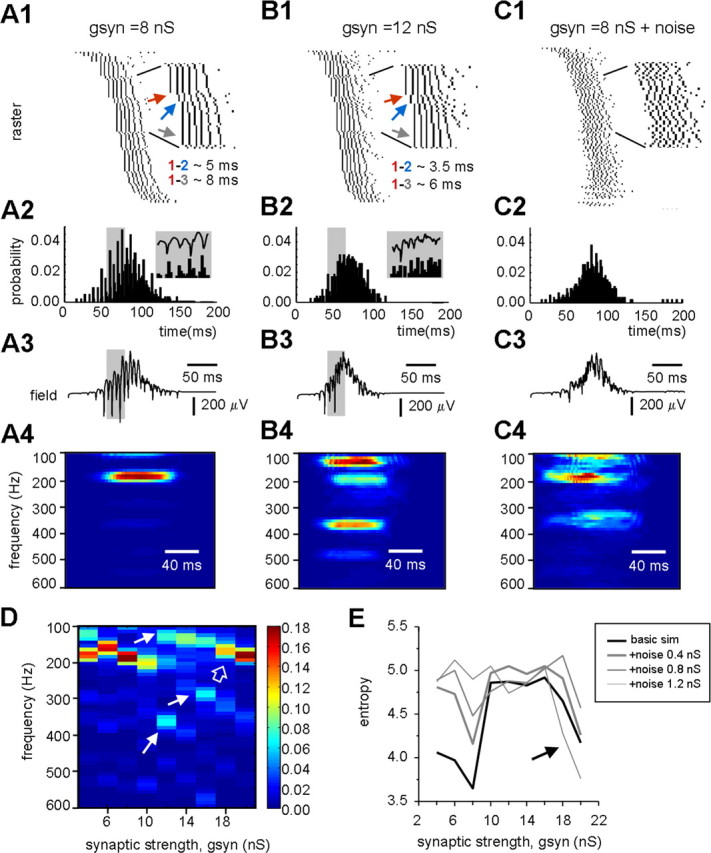
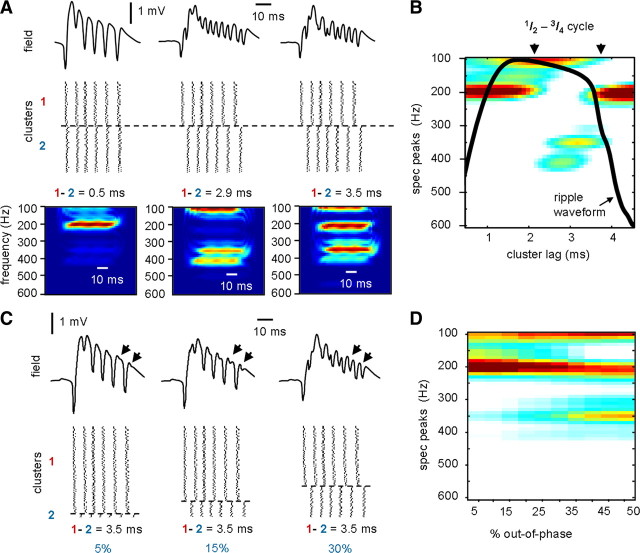
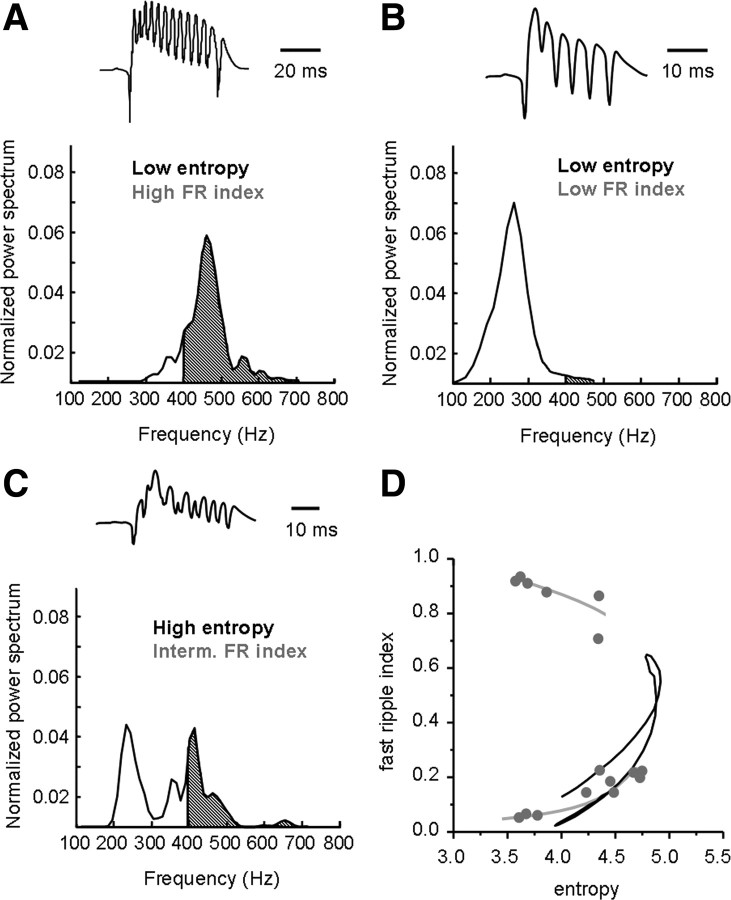
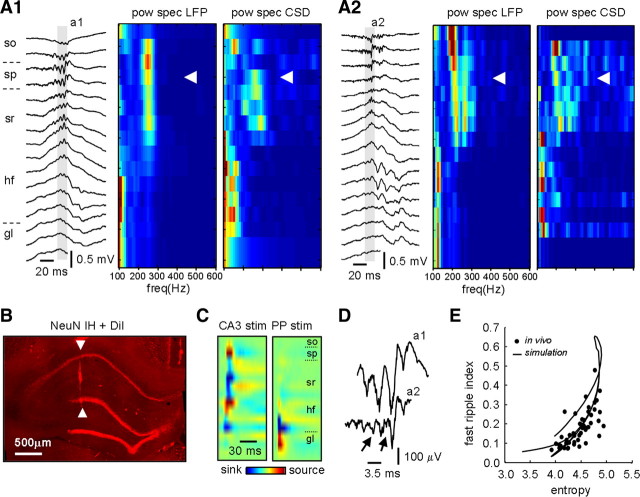
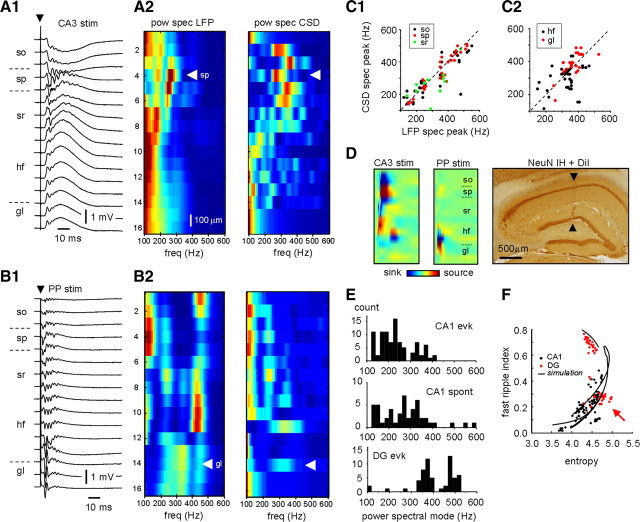
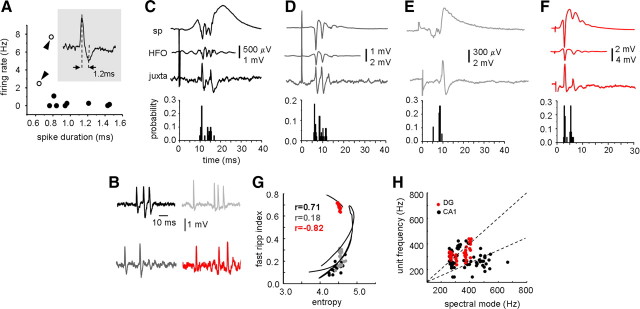
Fast ripples are a type of transient high-frequency oscillations recorded from the epileptogenic regions of the hippocampus and the temporal cortex of epileptic humans and rodents. These events presumably reflect hypersynchronous bursting of pyramidal cells. However, the oscillatory spectral content of fast ripples varies from 250 to 800 Hz, well above the maximal firing frequency of most hippocampal pyramidal neurons. How such high-frequency oscillations are generated is therefore unclear. Here, we combine computational simulations of fast ripples with multisite and juxtacellular recordings in vivo to examine the underlying mechanisms in the hippocampus of epileptic rats. We show that populations of bursting cells firing individually at 100-400 Hz can create fast ripples according to two main firing regimes: (1) in-phase synchronous firing resulting in "pure" fast ripples characterized by single spectral peaks that reflect single-cell behavior and (2) out-of-phase firing that results in "emergent" fast ripples. Using simulations, we found that fast ripples generated under these two different regimes can be quantitatively separated by their spectral characteristics, and we took advantage of this separability to examine their dynamics in vivo. We found that in-phase firing can reach frequencies up to 300 Hz in the CA1 and up to 400 Hz in the dentate gyrus. The organization of out-of-phase firing is determined by firing delays between cells discharging at low frequencies. The two firing regimes compete dynamically, alternating randomly from one fast ripple event to the next, and they reflect the functional dynamic organization of the different regions of the hippocampus.


Figures

Figure 1.
Figure 1.
Computational simulations of fast ripple oscillations. A, Fast ripples are thought to reflect population spikes from synchronous bursting cells. Here is an example of one spontaneous population discharge and the associated fast ripples as recorded from slices prepared from chronic epileptic rats. A simultaneous intracellular and field potential recording is shown. The time–frequency power spectrum of field potential oscillations confirms pure fast ripples characterized by a single spectral peak that reflect single-cell behavior. While multiple spectral peaks are predominant in fast ripple events recorded in slices from epileptic rats (Foffani et al., 2007), pure fast ripples are evident in some individual events. B, Simulation results from a network of 120 randomly connected intrinsically bursting neurons. At the onset of the simulation, one neuron fires a burst and recruits other neurons to fire. Most cells fire after tens of milliseconds of the triggering burst and contribute to generate field potential oscillations (black trace). Some cells remain hyperpolarized after an initial burst and reveal part of the underlying population EPSP (blue trace, arrow). Fast ripple oscillations at 180 Hz are detected at the field potential, which coincides with the intraburst frequency of single cells. C, Varying the dendritic conductance densities of Ca2+, Na+, and K+ channels, together with lower cell capacitance (1 μF · cm−2), accelerated the intraburst frequency of individual neurons. As a result, high-frequency oscillations resulting at the field potential shifted in a similar frequency range. Here is shown the case of an intraburst frequency of 380 Hz. D, Spectral peaks of pure single frequency field potential oscillations resulting from simulations with different intraburst frequencies.
Figure 2.
Figure 2.
Spectral features of emergent high-frequency field potential oscillations. A raster representation of the firing from all neurons in the simulation facilitates the interpretation of how field potential oscillations develop. A–C, Results are illustrated in a columnar arrangement for simulations using two different synaptic strengths: gsyn = 8 nS (A) and gsyn = 12 nS (B); and for gsyn = 8 nS plus added glutamatergic (0.8 nS) and GABAergic (0.75 nS) synaptic noise (C). In all cases, the intraburst frequency of individual neuronal bursting was 180 Hz. A1, B1, C1, Rasters are ordered according to the timing of individual neuronal firing in the simulation shown in A1. Three neuronal clusters are indicated with red, blue, and gray arrows to emphasize their activation delays and enlarged at right. A2, B2, C2, Firing histograms obtained from the rasters shown above. The insets show histogram details indicated in gray, together with the concurrent field potential oscillation. A3, B3, C3, Simulated field potential recordings show population events with fast ripple oscillations. A4, B4, C4, Time–frequency analysis of the fast ripple events shown above. Power spectrum values are color coded from zero to maximum. D, Spectral peaks of fast ripple oscillations resulting from simulations with different synaptic strength. Note the emergence of frequency components faster and slower than 180 Hz for gsyn > 10 nS (white arrows). For synaptic strength gsyn ≥ 18 nS, pure single-peaked oscillations are reinstated (open arrow). E, Plot of the spectral entropy, which is a measure of the spectral disorganization, against the synaptic strength for the simulations shown in D (black trace) and for three levels of glutamatergic synaptic noise (gray traces).
Figure 3.
Figure 3.
Temporal features of emergent fast ripple oscillations. A, Simulated field potentials and rasters generated by two nonconnected clusters that fire independently at an intraburst frequency of 180 Hz with lags of 0.5 ms (left), 2.9 ms (middle), and 3.5 ms (right). Note the emergent peaks in the time–frequency spectrum for 2.9 and 3.5 ms lags. B, Dependence of the spectral peaks on the cluster lag, which was changed in the range of 0.5 to 4.5 ms at 0.1 ms steps. Note the emergence of spectral components of the basic oscillation at 180 Hz. A ripple waveform was scaled on the cluster lag axis to highlight the relationship between lags and the oscillatory cycle. C, Simulated field potentials and rasters generated by clusters of different sizes that fire independently at an intraburst frequency of 180 Hz with a lag of 3.5 ms. The percentage values indicate the proportion of the whole population (clusters 1 + 2) that fire out-of-phase (cluster 2). Arrows point to the out-of-phase cycles contributed by cells in cluster 2. D, Dependence of the spectral peaks on the percentage of neurons firing out-of-phase.
Figure 4.
Figure 4.
Spectral features of pure and emergent fast ripple oscillations. Schematic diagram illustrating the relationship between the spectral entropy and the FR index for pure and emergent fast ripple oscillations. Each panel show a representative waveform of the fast ripple oscillation and the corresponding normalized power spectrum, from where the spectral entropy and FR index are obtained. A, B, Pure fast ripples exhibit a single spectral peak that reflects in-phase cellular firing of similar frequency. Consequently, their power spectrum has low entropy values. Pure fast ripples with significant spectral components faster than 400 Hz (shadowed region) will exhibit high values of the FR index (A), while slower pure fast ripples will exhibit low values of the FR index. C, Emergent fast ripples are characterized by multipeaked spectra of high entropy values. Typically, emergent spectral peaks significantly contribute to the upper fast ripple band giving intermediate values of the FR index. Hence, the major spectral features of pure and emergent fast ripples can be quantified using both the spectral entropy and the FR index. D, Plot of the spectral entropy against the fast ripple index for the cluster lag simulations shown in Figure 3B (black) and for simulations of pure oscillations shown in Figure 1D (gray).
Figure 5.
Figure 5.
Spontaneous fast ripples in vivo. A1, A2, Two consecutive spontaneous fast ripple events recorded in vivo with 16-channel silicon probes. The electrode position alongside the different strata is indicated. The power spectrum from the LFPs and from the CSD profiles at each channel is plotted in a color-coded scale from zero to maximum. White arrowheads indicate the stratum pyramidale. B, Immunostaining (IH) against the neuronal marker NeuN. Note cell loss in the CA3 and hilar regions and the probe track marked with DiI (between arrowheads). See supplemental Figure 1E (available at www.jneurosci.org as supplemental material) for an enlarged view. C, CSD profiles of the responses to subthreshold contralateral CA3 and perforant path (PP) stimulation. D, Details of the LFP signals recorded at the stratum pyramidale in panels A1 and A2 (shadowed regions a1 and a2). E, Plot of spectral entropy against the fast ripple index for 49 spontaneous events recorded from 6 rats. Note the similarity with simulations (black trace).
Figure 6.
Figure 6.
Stimulation-evoked fast ripples in vivo. A1, Local field potential responses to contralateral CA3 stimulation (arrowhead). A2, The power spectrum from the LFPs (left) and from the CSD (right) profiles at each channel is plotted in a color-coded scale from zero to maximum (see supplemental Fig. 4, available at www.jneurosci.org as supplemental material, for the CSD profiles). White arrowheads indicate the stratum pyramidale with similar spectral response between the LFP and the CSD spectra. B1, Laminar responses to ipsilateral perforant path (PP) stimulation (arrowhead). B2, Power spectra obtained from the LFP and the CSD profiles (for the CSD profiles, see supplemental Fig. 4, available at www.jneurosci.org as supplemental material). White arrowheads indicate the granule cell layer. C1, Correspondence between the spectral peaks obtained from the LFP and from the CSD profiles at the strata oriens (so), pyramidale (sp), and radiatum (sr) of the CA1 region upon contralateral CA3 stimulation. C2, Same representation for the profiles obtained at the hippocampal fissure (hf) and granule layer (gl) upon PP stimulation. D, Subthreshold CSD profiles and NeuN immunostaining (IH) for the experiment shown in A and B. See supplemental Figure 1F (available at www.jneurosci.org as supplemental material) for an enlarged view of the NeuN section. The probe track is indicated by arrowheads. E, Distribution of the most probable frequency peak (mode) from stimulation-evoked (CA1 evk) and spontaneous (CA1 spont) CA1 oscillations and for the dentate gyrus stimulation-evoked events (DG evk). F, Plot of spectral entropy against the fast ripple index from 91 stimulation-evoked events in the CA1 region (black) and from 60 stimulation-evoked events in the DG (red). Red arrow indicates red points distributed in the lower part of the curve.
Figure 7.
Figure 7.
Juxtacellular recordings in vivo. A, Plot of the spike duration versus the firing rate for CA1 unit classification as pyramidal cells (black) and putative interneurons (open dots). The inset illustrates spike width estimation. B, Spontaneous firing patterns from units shown as color coded in C to F. The black, gray, and light gray traces correspond to CA1 units shown in C–E, respectively. The red trace correspond to the unit at the dentate gyrus (DG) shown in F. C, Representative response of CA1 units to contralateral CA3 stimulation seen in 4/8 units. Local field potential recording at the stratum pyramidale (SP) and the associated high-frequency oscillations (HFO) are shown, together with the firing histogram. D, One CA1 neuron responded with bursts that were synchronous with the field potential recording. E, Three of eight CA1 neurons fired single spikes in response to contralateral CA3 stimulation. In these cases, the oscillatory field potential component was not clear. F, Representative response seen in 5/5 DG units to perforant path stimulation. G, Plot of the spectral entropy against the fast ripple index for the field potential oscillations of experiments shown in C, D, and F, with similar colors. The r values of a Pearson correlation are shown for each case. Lines correspond to simulation prediction. H, Unit firing frequency is plotted against the spectral peaks of the nearby fast ripple oscillations (250–800 Hz) for CA1 (black) and DG (red). An identity discontinuous line is shown to illustrate the dependence of neuronal firing rate on oscillatory frequency. A second discontinuous line indicates the harmonic behavior (frequency = 0.5 × spectral mode).

Similar articles

Cited by

References

    1. Adrian E. Discharge frequencies in the cerebral and cerebellar cortex. Proc Phys Soc. 1935;83:32–33.
    1. Andersen P, Bliss TVP, Skrede KK. Unit analysis of hippocampal population spikes. Exp Brain Res. 1971;13:208–221. - PubMed
    1. Barth DS. Submillisecond synchronization of fast electrical oscillations in neocortex. J Neurosci. 2003;23:2502–2510. - PMC - PubMed
    1. Beenhakker MP, Huguenard JR. Neurons that fire together also conspire together: is normal sleep circuitry hijacked to generate epilepsy? Neuron. 2009;62:612–632. - PMC - PubMed
    1. Bernard C, Anderson A, Becker A, Poolos NP, Beck H, Johnston D. Acquired dendritic channelopathy in temporal lobe epilepsy. Science. 2004;305:532–535. - PubMed

Publication types