. 2011 Jan;121(1):212-25.
doi: 10.1172/JCI43144. Epub 2010 Dec 1.

Thioredoxin-like 2 regulates human cancer cell growth and metastasis via redox homeostasis and NF-κB signaling

Affiliations

Thioredoxin-like 2 regulates human cancer cell growth and metastasis via redox homeostasis and NF-κB signaling

Ying Qu et al. J Clin Invest. 2011 Jan.

Abstract

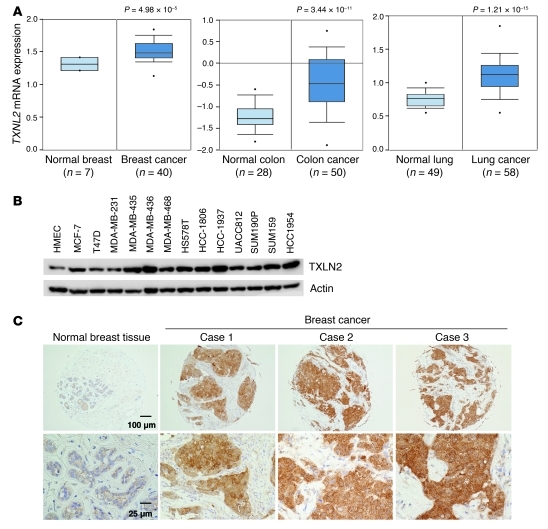
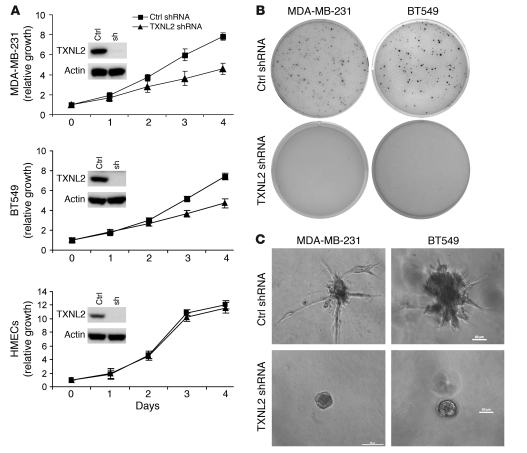
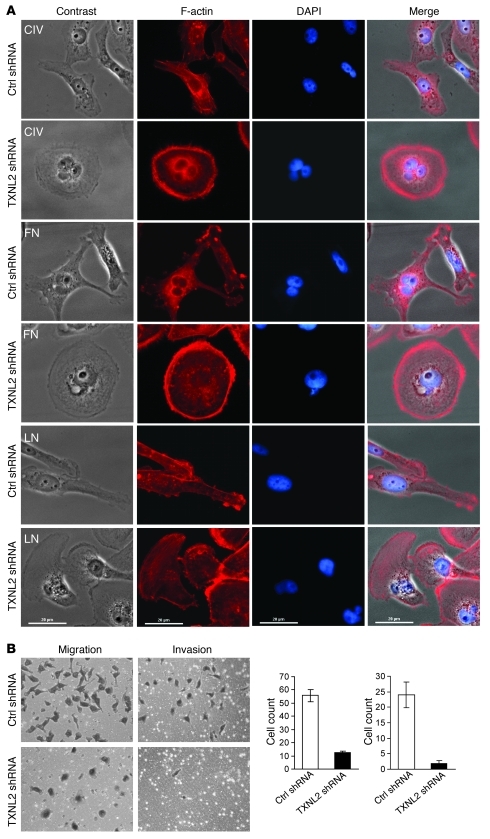
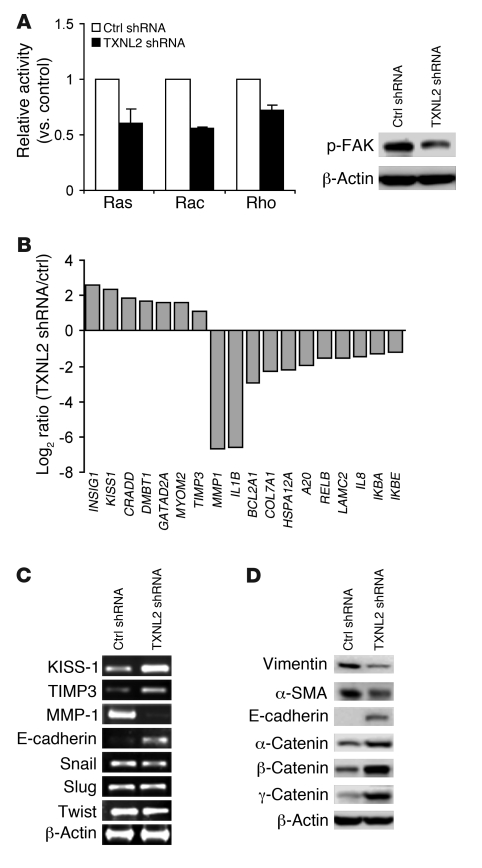
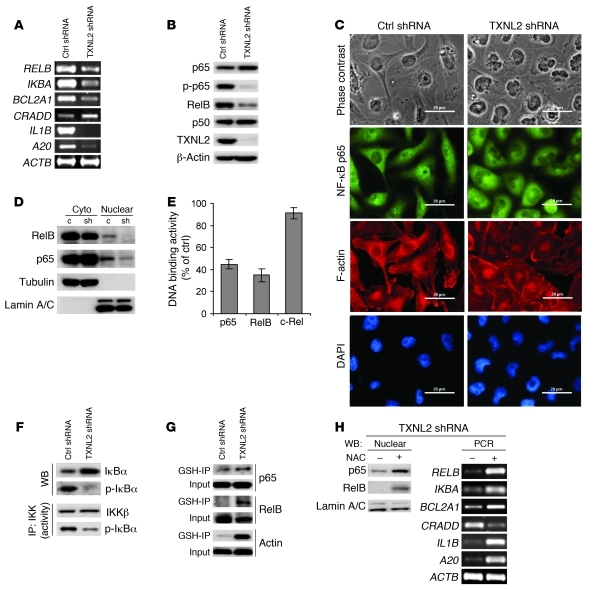
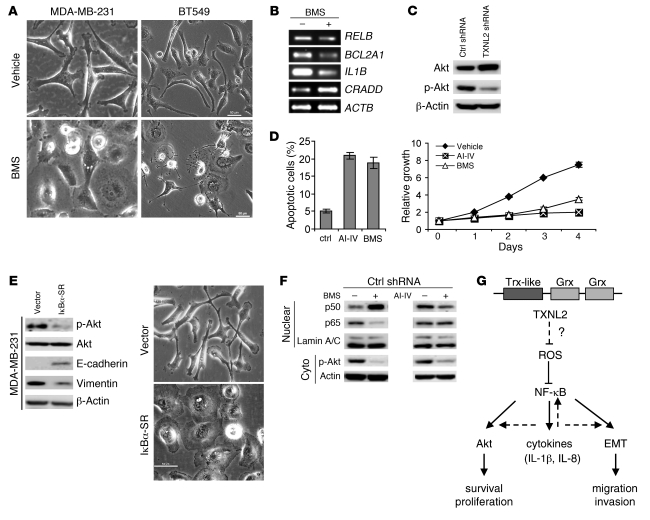
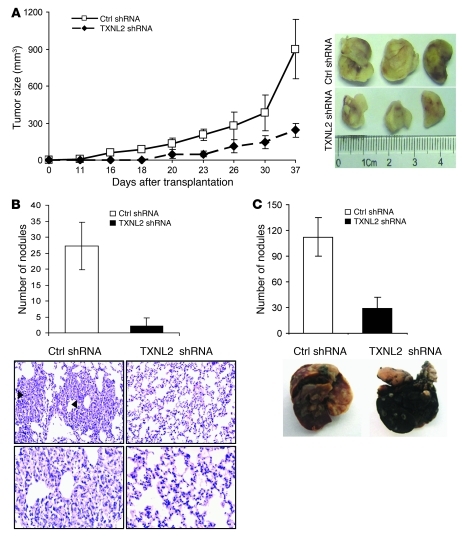
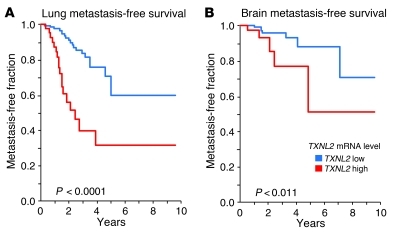
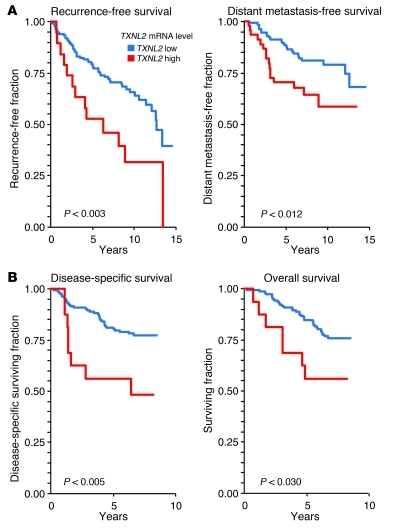
Cancer cells have an efficient antioxidant system to counteract their increased generation of ROS. However, whether this ability to survive high levels of ROS has an important role in the growth and metastasis of tumors is not well understood. Here, we demonstrate that the redox protein thioredoxin-like 2 (TXNL2) regulates the growth and metastasis of human breast cancer cells through a redox signaling mechanism. TXNL2 was found to be overexpressed in human cancers, including breast cancers. Knockdown of TXNL2 in human breast cancer cell lines increased ROS levels and reduced NF-κB activity, resulting in inhibition of in vitro proliferation, survival, and invasion. In addition, TXNL2 knockdown inhibited tumorigenesis and metastasis of these cells upon transplantation into immunodeficient mice. Furthermore, analysis of primary breast cancer samples demonstrated that enhanced TXNL2 expression correlated with metastasis to the lung and brain and with decreased overall patient survival. Our studies provided insight into redox-based mechanisms underlying tumor growth and metastasis and suggest that TXNL2 could be a target for treatment of breast cancer.


Figures

Figure 1
Figure 1. Expression of TXNL2 in human cancers and breast cancer tissues/cell lines.
(A) Microarray data analyses of TXNL2 expression in human cancers are shown. TXNL2 mRNA levels in human normal/cancer tissues (breast [ref. 35], colon [ref. 37], and lung [ref. 36]) are plotted. The Student t test was conducted using the Oncomine software. The boxes represent the 25th through 75th percentiles. The horizontal lines represent the medians. The whiskers represent the 10th and 90th percentiles, and the asterisks represent the end of the ranges. (B) Expression of TXNL2 in normal human breast epithelial cells (HMECs) and 13 breast cancer cell lines was examined using Western blotting. β-Actin was used as a loading control. (C) Immunohistochemistry of TXNL2 on tissue microarrays containing normal breast and breast cancer tissues. Low-magnification (top; original magnification, ×100) and high-magnification (bottom; original magnification, ×400) images of representative staining are shown.
Figure 2
Figure 2. Knockdown of TXNL2 in breast cancer cells inhibits cell growth.
(A) Cell proliferation was measured using MTT assays, and growth curves of control and TXNL2-KD cells are plotted. The data represent mean ± SD of 3 experiments. The inserts show immunoblots of TXNL2 expression in control (ctrl) and TXNL2-KD (sh) cells. (B) Colony formation of control and TXNL2-KD cells in soft agar after 14 days of culture. (C) The growth of control and TXNL2-KD cells in 3D Matrigel is shown (original magnification, ×200).
Figure 3
Figure 3. Knockdown of TXNL2 blocks the motility of MDA-MB-231 cells.
(A) Cell morphologies on different extra­cellular matrix surfaces are shown. Control and TXNL2-KD MDA-MB-231 cells were plated on collagen IV (CIV), fibronectin (FN), and lamin (LN). F-actin was stained with Alexa Fluor–labeled phalloidin. DAPI was used to visualize cell nuclei (original magnification, ×400). (B) Migration and invasion of control and TXNL2-KD cells were measured using transwell chamber assays. Data represent the average cell number from 5 viewing fields (original magnification, ×200).
Figure 4
Figure 4. Knockdown of TXNL2 alters small GTPase activity and cell motility-associated gene expression.
(A) Relative activities of Ras, RhoA, and Rac are plotted. Error bars indicate SD. p-FAK was examined using Western blotting. (B) Log2 ratios of normalized intensity (TXNL2-KD/control) for top-ranked upregulated/downregulated genes in the microarray analysis of TXNL2-KD cells. (C) Expression of KISS-1, TIMP3, MMP-1, E-cadherin, Snail, Slug, and Twist was measured using RT-PCR, with β-actin as a control. (D) Expression of mesenchymal markers (vimentin and α-SMA) and epithelial markers (E-cadherin and α-, β-, and γ-catenin) was measured using immunoblotting.
Figure 5
Figure 5. Knockdown of TXNL2 increases intra­cellular ROS.
(A) ROS levels were measured using DCFH-DA staining, followed by flow cytometry. Cell apoptosis was measured using Annexin V/PI double staining, followed by flow cytometry. (B) Intracellular ROS and cell apoptosis were measured in control and TXNL2-KD cells after treatment with H2O2 or diamide. Fold increases of ROS and apoptotic rate (TXNL2-KD/control) are plotted. (C) BSO-induced apoptosis in control MDA-MB-231 cells was measured using Annexin V/PI staining, and apoptotic rates are plotted. Images show cell morphologies without and with BSO treatment. (D) Cell apoptosis was measured using Annexin V/PI staining in TXNL2-KD MDA-MB-231 cells treated with or without NAC for 48 hours. Morphologies of TXNL2-KD cells treated with or without NAC are shown. Scale bar: 50 μm.
Figure 6
Figure 6. TXNL2 knockdown blocks NF-κB activity in breast cancer cells.
(A) Expression of NF-κB–regulated genes in control and TXNL2-KD cells was measured using semiquantitative RT-PCR. (B) Expression of NF-κB components was examined using immunoblotting. (C) Nuclear localization of p65 in control and TXNL2-KD MDA-MB-231 cells was visualized using indirect immunofluorescence staining. F-actin (red) was used to show cell morphology, and DAPI (blue) was used to show nuclei. Scale bar: 20 μm. (D) Expression of p65 and RelB in cytosolic (cyto) and nuclear fractions from control (c) and TXNL2 shRNA (sh) cells was examined using immunoblotting. Tubulin and lamin A/C were used as cytoplasmic and nuclear markers, respectively. (E) The relative DNA binding activities (% of control) of p65, RelB, and c-Rel were measured by TransAM DNA-binding ELISA. Data represent mean ± SD of 3 experiments. (F) In vitro IKK activity assays were performed. IKK activity was indicated by p-IκBα levels. Total IκBα and p-IκBα levels in control and TXNL2-KD cells were assessed using immunoblotting. (G) Glutathionylation of p65 and RelB was examined using GSH immunoprecipitation, followed by immunoblotting. (H) TXNL2-KD MDA-MB-231 cells were treated with NAC for 6 hours. Nuclear localization of p65 and RelB was examined by immunoblotting. NF-κB–regulated genes were measured by semiquantitative RT-PCR.
Figure 7
Figure 7. NF-κB is essential for the effects of TXNL2 on cell survival and EMT.
(A) Morphologies of control MDA-MB-231 and BT549 cells treated with the IKK inhibitor BMS-345541 (BMS) or DMSO for 24 hours are shown (original magnification, ×200). (B) Expression of NF-κB–regulated genes was measured using RT-PCR in MDA-MB-231 cells treated with BMS-345541 or DMSO. (C) Total Akt and p-Akt levels in control and TXNL2-KD MDA-MB-231 cells were measured using Western blotting. (D) Apoptosis was measured using Annexin V/PI staining in MDA-MB-231 cells treated with vehicle (ctrl), AI-IV, or BMS. Data represent mean ± SD of 3 independent experiments. Growth curves of cells treated with or without inhibitors are plotted. (E) Akt activation and EMT markers (E-cadherin and vimentin) in IκBα-SR–overexpressing and control MDA-MB-231 cells were measured using Western blotting. Cell morphologies are shown (original magnification, ×200). (F) The expression of NF-κB and Akt after BMS or AI-IV treatment was examined using Western blotting. (G) A schematic diagram of TXNL2 signaling. Broken lines indicate pathways, based on previous reports. The question mark denotes currently unknown mechanisms.
Figure 8
Figure 8. TXNL2 knockdown inhibits tumorigenic and metastatic capabilities of MDA-MB-231 cells.
(A) Growth curves of mammary tumors after orthotopic injection of control and TXNL2-KD MDA-MB-231 cells in SCID mice. Data represent mean ± SD (n = 10). (B) Number of metastatic nodules per lung after injection of control and TXNL2-KD MDA-MB-231 cells in mouse fat pads (n = 10). Representative micrographs of lung tissues with metastatic cells (arrowheads) are shown. Original magnification, ×200 (top); ×400 (bottom). (C) The number of metastatic nodules per lung in control and TXNL2-KD groups 40 days after tail vein injections is plotted as mean ± SD (n = 10). Representative pictures of lungs stained by India ink are shown.
Figure 9
Figure 9. TXNL2 expression in human primary breast cancer predicts the occurrence of metastasis to lung and brain.
(A) Kaplan-Meier curves of lung metastasis-free survival of breast cancer patients, stratified by TXNL2 mRNA levels in an 192-sample data set (63). (B) Kaplan-Meier plots of brain metastasis-free survival of breast cancer patients, stratified by TXNL2 mRNA expression from the same data set.
Figure 10
Figure 10. Prognostic significance of TXNL2 in human breast cancer.
(A) Kaplan-Meier curves of recurrence-free survival and distant metastasis-free survival of breast cancer patients, stratified by TXNL2 mRNA levels in an 189-sample data set (65). (B) Kaplan-Meier curves of disease-specific survival and overall survival of breast cancer patients, stratified by TXNL2 mRNA levels in an 159-sample data set (64).

References

    1. Droge W. Free radicals in the physiological control of cell function. Physiol Rev. 2002;82(1):47–95. - PubMed
    1. Bergendi L, Benes L, Durackova Z, Ferencik M. Chemistry, physiology and pathology of free radicals. Life Sci. 1999;65(18–19):1865–1874. doi: 10.1016/S0024-3205(99)00439-7. - DOI - PubMed
    1. Trachootham D, Lu W, Ogasawara MA, Nilsa RD, Huang P. Redox regulation of cell survival. Antioxid Redox Signal. 2008;10(8):1343–1374. doi: 10.1089/ars.2007.1957. - DOI - PMC - PubMed
    1. Holmgren A, Johansson C, Berndt C, Lonn ME, Hudemann C, Lillig CH. Thiol redox control via thioredoxin and glutaredoxin systems. Biochem Soc Trans. 2005;33(pt 6):1375–1377. doi: 10.1042/BST20051375. - DOI - PubMed
    1. Kirshner JR, et al. Elesclomol induces cancer cell apoptosis through oxidative stress. Mol Cancer Ther. 2008;7(8):2319–2327. doi: 10.1158/1535-7163.MCT-08-0298. - DOI - PubMed

Publication types

MeSH terms