

Early detection of complete vascular occlusion in a pedicle flap model using quantitative [corrected] spectral imaging
- PMID: 21124132
- PMCID: PMC3338201
- DOI: 10.1097/PRS.0b013e3181f447ac
Early detection of complete vascular occlusion in a pedicle flap model using quantitative [corrected] spectral imaging
Erratum in
- Plast Reconstr Surg. 2011 Feb;127(2):1024
Abstract
Background: Vascular occlusion after tissue transfer is a devastating complication that can lead to complete flap loss. Spatial frequency domain imaging is a new, noncontact, noninvasive, wide-field imaging technology capable of quantifying oxygenated and deoxygenated hemoglobin levels, total hemoglobin, and tissue saturation.
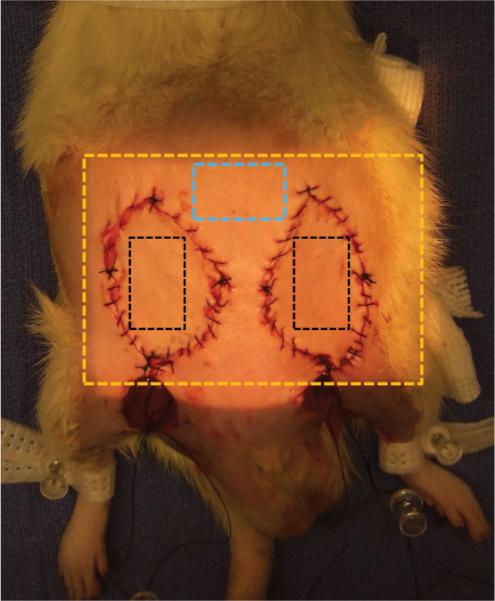
Methods: Pedicled fasciocutaneous flaps on Wistar rats (400 to 500 g) were created and underwent continuous imaging using spatial frequency domain imaging before and after selective vascular occlusion. Three flap groups (control, selective arterial occlusion, and selective venous occlusion) and a fourth group composed of native skin between the flaps were measured.
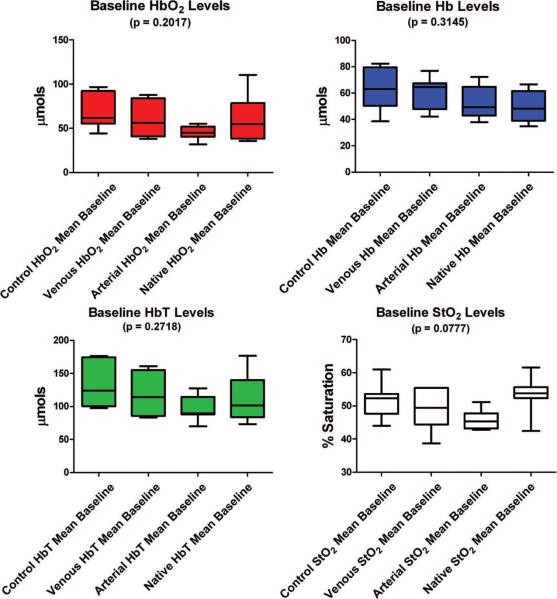
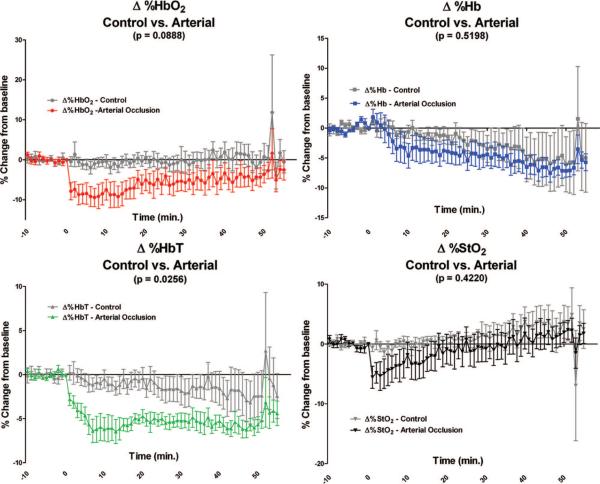
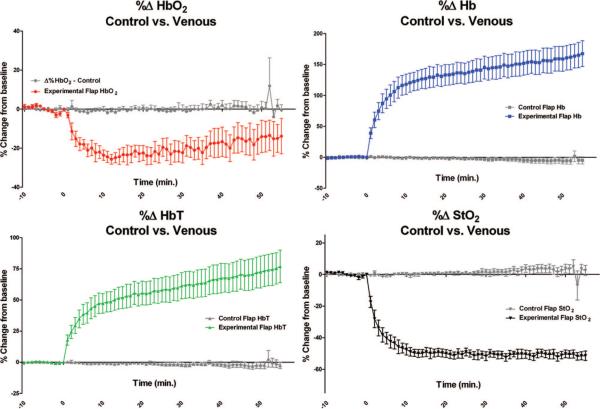
Results: There were no statistically significant differences between the control flap group and the experimental flap groups before selective vascular occlusion: oxyhemoglobin (p=0.2017), deoxyhemoglobin (p=0.3145), total hemoglobin (p=0.2718), and tissue saturation, (p=0.0777). In the selective arterial occlusion flap group, percentage change in total hemoglobin was statistically different from that of the control flap group (p=0.0218). The remaining parameters were not statistically different from those of the control flap: percentage change in oxyhemoglobin (p=0.0888), percentage change in deoxyhemoglobin (p=0.5198), and percentage change in tissue saturation (p=0.4220). The selective venous occlusion flap group demonstrated changes statistically different compared with the control flap group: percentage change in oxyhemoglobin (p=0.0029) and deoxyhemoglobin, total hemoglobin, and tissue saturation (p<0.0001).
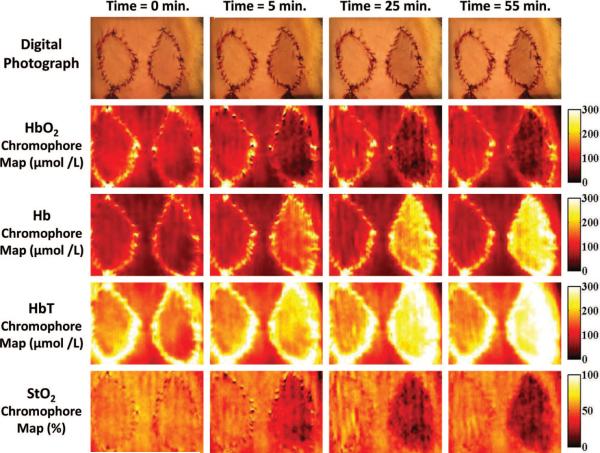
Conclusions: Spatial frequency domain imaging provides two-dimensional, spatially resolved maps of tissue oxyhemoglobin, deoxyhemoglobin, total hemoglobin, and tissue saturation. Results presented here indicate that this can be used to quantify and detect physiologic changes that occur after arterial and venous occlusion in a rodent tissue transfer flap model. This portable, noncontact, noninvasive device may have a high clinical applicability in monitoring postoperative patients.
Figures
Similar articles
-
Postoperative quantitative assessment of reconstructive tissue status in a cutaneous flap model using spatial frequency domain imaging.Plast Reconstr Surg. 2011 Jan;127(1):117-130. doi: 10.1097/PRS.0b013e3181f959cc. Plast Reconstr Surg. 2011. PMID: 21200206 Free PMC article.
-
Noninvasive Monitoring of Deep Tissue Oxygenation in Buried Flaps by Time-Resolved Near-Infrared Spectroscopy in Pigs.Plast Reconstr Surg. 2020 Nov;146(5):565e-577e. doi: 10.1097/PRS.0000000000007255. Plast Reconstr Surg. 2020. PMID: 33141532
-
The use of near-infrared spectroscopy for assessing flap viability during reconstructive surgery.Br J Plast Surg. 1998 Apr;51(3):218-26. doi: 10.1054/bjps.1997.0145. Br J Plast Surg. 1998. PMID: 9664881
-
Intraoperative Hemifacial Composite Flap Perfusion Assessment Using Spatial Frequency Domain Imaging: A Pilot Study in Preparation for Facial Transplantation.Ann Plast Surg. 2016 Feb;76(2):249-55. doi: 10.1097/SAP.0000000000000631. Ann Plast Surg. 2016. PMID: 26418791 Free PMC article.
-
Critical time for neovascularization/angiogenesis to allow free flap survival after delayed postoperative anastomotic compromise without surgical intervention: A review of the literature.Microsurgery. 2016 Oct;36(7):604-612. doi: 10.1002/micr.30082. Epub 2016 Jul 4. Microsurgery. 2016. PMID: 27375230 Review.
Cited by
-
Single snapshot of optical properties image quality improvement using anisotropic two-dimensional windows filtering.J Biomed Opt. 2019 Mar;24(7):1-21. doi: 10.1117/1.JBO.24.7.071611. J Biomed Opt. 2019. PMID: 30927346 Free PMC article.
-
Hybrid diffusion and two-flux approximation for multilayered tissue light propagation modeling.Appl Opt. 2011 Jul 20;50(21):4237-45. doi: 10.1364/AO.50.004237. Appl Opt. 2011. PMID: 21772413 Free PMC article.
-
Flap Monitoring Using Transcutaneous Oxygen or Carbon Dioxide Measurements.J Hand Microsurg. 2020 Nov 16;14(1):10-18. doi: 10.1055/s-0040-1718862. eCollection 2022 Jan. J Hand Microsurg. 2020. PMID: 35256823 Free PMC article. Review.
-
Real-time optical properties and oxygenation imaging using custom parallel processing in the spatial frequency domain.Biomed Opt Express. 2019 Jul 11;10(8):3916-3928. doi: 10.1364/BOE.10.003916. eCollection 2019 Aug 1. Biomed Opt Express. 2019. PMID: 31452984 Free PMC article.
-
Early detection and differentiation of venous and arterial occlusion in skin flaps using visible diffuse reflectance spectroscopy and autofluorescence spectroscopy.Biomed Opt Express. 2016 Jan 19;7(2):570-80. doi: 10.1364/BOE.7.000570. eCollection 2016 Feb 1. Biomed Opt Express. 2016. PMID: 26977363 Free PMC article.
References
-
- Bui DT, Cordeiro PG, Hu QY, Disa JJ, Pusic A, Mehrara BJ. Free flap reexploration: Indications, treatment, and outcomes in 1193 free flaps. Plast Reconstr Surg. 2007;119:2092–2100. - PubMed
-
- Khouri RK, Cooley BC, Kunselman AR, et al. A prospective study of microvascular free-flap surgery and outcome. Plast Reconstr Surg. 1998;102:711–721. - PubMed
-
- Kroll SS, Schusterman MA, Reece GP, et al. Timing of pedicle thrombosis and flap loss after free-tissue transfer. Plast Reconstr Surg. 1996;98:1230–1233. - PubMed
-
- Panchapakesan V, Addison P, Beausang E, Lipa JE, Gilbert RW, Neligan PC. Role of thrombolysis in free-flap salvage. J Reconstr Microsurg. 2003;19:523–530. - PubMed
-
- Brown JS, Devine JC, Magennis P, Sillifant P, Rogers SN, Vaughan ED. Factors that influence the outcome of salvage in free tissue transfer. Br J Oral Maxillofac Surg. 2003;41:16–20. - PubMed
Publication types
MeSH terms
Substances
Grants and funding
LinkOut - more resources
Full Text Sources
Medical
