. 2010 Dec 2;468(7324):653-8.
doi: 10.1038/nature09571.

Lkb1 regulates cell cycle and energy metabolism in haematopoietic stem cells

Affiliations

Lkb1 regulates cell cycle and energy metabolism in haematopoietic stem cells

Daisuke Nakada et al. Nature. .

Abstract

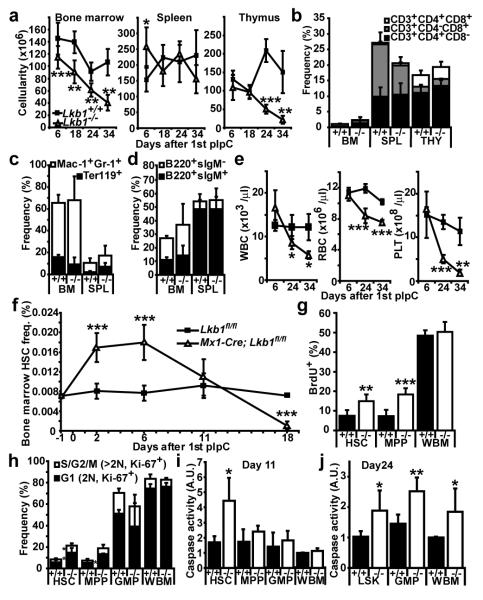
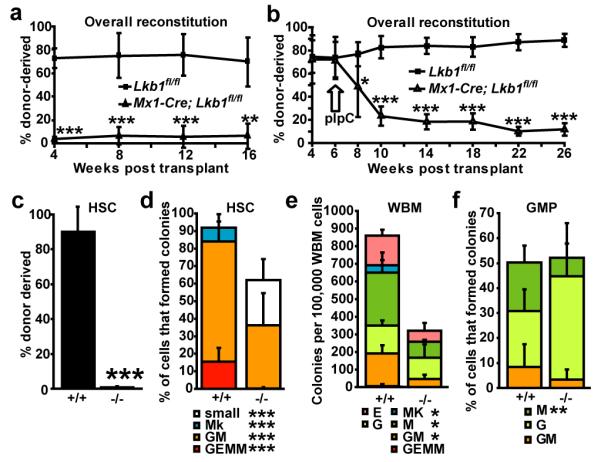
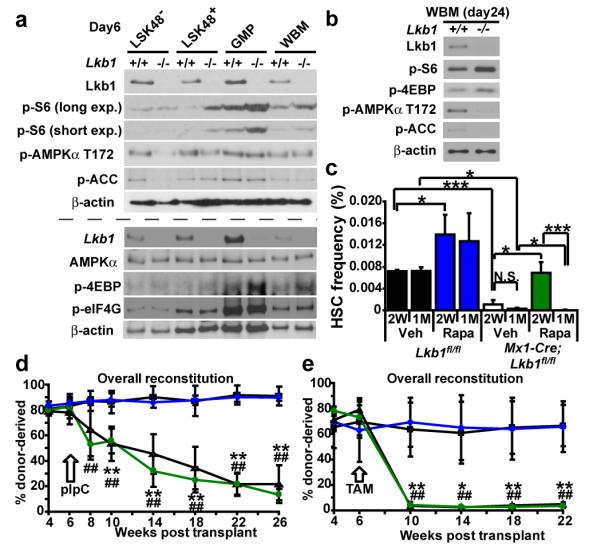
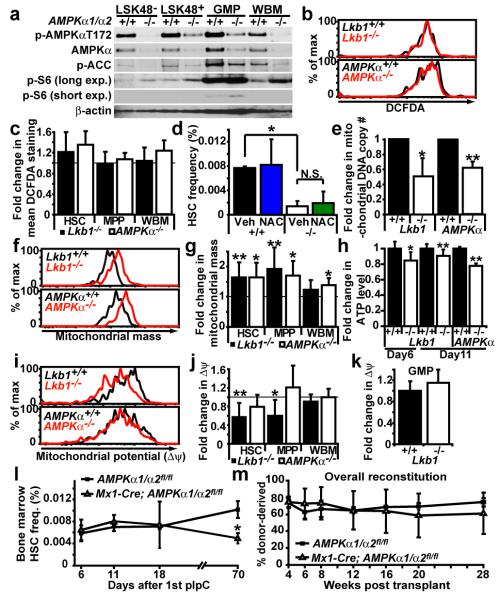
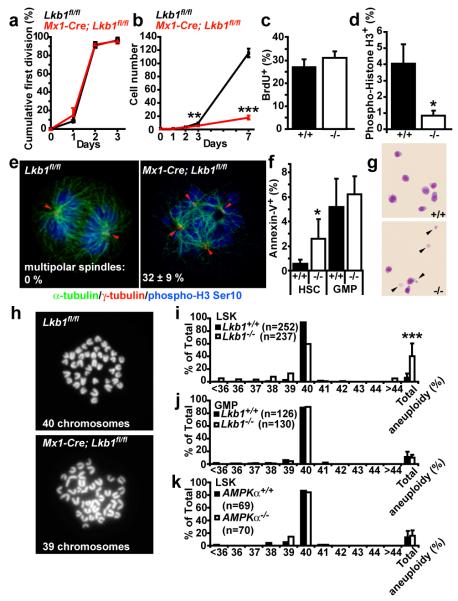
Little is known about metabolic regulation in stem cells and how this modulates tissue regeneration or tumour suppression. We studied the Lkb1 tumour suppressor and its substrate AMP-activated protein kinase (AMPK), kinases that coordinate metabolism with cell growth. Deletion of the Lkb1 (also called Stk11) gene in mice caused increased haematopoietic stem cell (HSC) division, rapid HSC depletion and pancytopenia. HSCs depended more acutely on Lkb1 for cell-cycle regulation and survival than many other haematopoietic cells. HSC depletion did not depend on mTOR activation or oxidative stress. Lkb1-deficient HSCs, but not myeloid progenitors, had reduced mitochondrial membrane potential and ATP levels. HSCs deficient for two catalytic α-subunits of AMPK (AMPK-deficient HSCs) showed similar changes in mitochondrial function but remained able to reconstitute irradiated mice. Lkb1-deficient HSCs, but not AMPK-deficient HSCs, exhibited defects in centrosomes and mitotic spindles in culture, and became aneuploid. Lkb1 is therefore required for HSC maintenance through AMPK-dependent and AMPK-independent mechanisms, revealing differences in metabolic and cell-cycle regulation between HSCs and some other haematopoietic progenitors.


Figures

Figure 1
Figure 1. Lkb1 deletion causes HSCs to go into cycle before being depleted
a, Lkb1 deletion had a limited effect on the cellularity of whole bone marrow (WBM), spleen (SPL) or thymus (THY) 6 to 18 days after starting pIpC but WBM and thymus cellularity declined significantly by 24 to 34 days (all panels show mean±standard deviation from at least 3 independent experiments; *, p<0.05; **, p<0.005; and ***, p<0.0005 by Student’s t-test in all figures). +/+ indicates Lkb1fl/fl mice and −/− indicates Mx1-Cre; Lkb1fl/fl mice. b-d, Lkb1 deletion had little effect on T (b), myeloid or erythroid (c), or B (d) lineage cells 18 days after pIpC treatment. e, White blood cells (WBC), red blood cells (RBC) and platelets (PLT) were significantly depleted in the blood of Lkb1-deficient mice by 24 to 34 days after pIpC treatment. f, HSC (CD150+CD48CD41lineageSca-1+c-kit+) frequency significantly increased 2-6 days and significantly reduced 18 days following pIpC treatment in Lkb1-deficient mice. g, Lkb1-deficient HSCs and MPPs, but not WBM cells, incorporated significantly more BrdU (24 hour pulse) 6 days after pIpC treatment. h, Lkb1 deletion drove HSCs and MPPs into cycle, increasing the frequency of these cells in G1 (Ki-67+ cells with 2N DNA content, 2.5-fold, p<0.05) and S/G2/M phases of the cell cycle (Ki67+ cells with >2N DNA content, 2.4-fold, p<0.05) at day 6, but did not affect the cell cycle distribution of GMPs or WBM cells. Lkb1-deficient HSCs had significantly increased caspase activity (i, 2.6-fold) at day 11, but other haematopoietic progenitors did not significantly increase caspase activity until day 24 (j).
Figure 2
Figure 2. Lkb1-deficient HSCs have a cell autonomous defect in their ability to reconstitute irradiated mice and to form colonies in culture
a-d, 1×10⁶ donor WBM cells from Lkb1fl/fl or Mx1-Cre; Lkb1fl/fl mice were transplanted into irradiated recipient mice along with 500,000 recipient WBM cells. The transplant was performed 6 days after (a) or 6 weeks before (b) pIpC treatment. Reconstitution levels were monitored for 16-20 weeks after transplantation (a) or after pIpC treatment (b). Data are from one representative experiment of each type out of 3 independent experiments of each type. c, Donor HSCs (CD150+CD48CD41lineageSca-1+c-kit+) were depleted in recipients of Mx1-Cre; Lkb1fl/fl (Lkb1-deficient) cells two month after pIpC treatment. Data are from 4 independent experiments. 6 days after pIpC treatment, the frequencies of HSCs (d), WBM cells (e), and GMPs (f) that formed granulocyte, erythroid, macrophage, megakaryocyte (GEMM), granulocyte, macrophage (GM), megakaryocyte (Mk), “small” colonies with fewer than 100 cells, or single lineage (G, or M, or E) colonies in culture. Data (mean±standard deviation) are from 3-16 independent experiments per cell type (*, significantly different between Lkb1-deficient and control by Student’s t-test).
Figure 3
Figure 3. AMPK signaling requires Lkb1 in HSCs/MPPs but HSC depletion could not be rescued with rapamycin
a, Six days after pIpC treatment, Lkb1 deletion increased mTORC1 activation (phospho-S6 and phospho-4EBP levels) in restricted progenitors (LSK48+ cells, GMPs, and WBM cells) but not in LSK48- cells (HSCs/MPPs). Decreased phospho-AMPKa T172 was noted in Lkb1-deficient LSK48 and to a lesser extent in LSK48+ cells but not in GMPs or WBM cells. phospho-ACC was decreased in Lkb1-deficient LSK48 cells but not in other populations. We did not observe a consistent change in phospho-eIF4G levels after Lkb1-deletion in any population. Each lane contained protein from 30,000 sorted cells. +/+ indicates Lkb1fl/fl cells and −/− indicates Mx1-Cre; Lkb1fl/fl cells after pIpC treatment. This panel reflects two independent experiments (upper and lower panels separated by the dashed line). b, 24 days after pIpC treatment, phospho-AMPKα T172 and phospho-ACC were decreased and phospho-S6 and phospho-4EBP levels were increased in Lkb1-deficient WBM cells. c-e, Rapamycin failed to rescue the depletion of Lkb1-deficient HSCs. c, Mice were treated with rapamycin after pIpC treatment for two weeks (2W) or one month (1M). Data are from 3-4 independent experiments. d-e, Rapamycin failed to rescue the reconstituting capacity of Lkb1-deficient HSCs, irrespective of whether Lkb1 was deleted using pIpC in Mx1-Cre; Lkb1fl/fl mice (d) or tamoxifen in Ubc-CreERT2 mice (e). In each case, 1×10⁶ donor WBM cells from untreated mutant (Mx1-Cre; Lkb1fl/fl in d; Ubc-CreERT2; Lkb1fl/fl in e) or control (Lkb1fl/fl) mice were transplanted into irradiated mice along with 500,000 recipient WBM cells. Six weeks after transplantation, all recipients were treated with pIpC (d) or tamoxifen (e), then treated with rapamycin or vehicle. One representative experiment is shown out of 2-3 independent experiments for each mode of Lkb1 deletion (**, p<0.005 for Lkb1fl/fl versus Mx1-Cre/Ubc-CreERT2; Lkb1fl/fl recipients treated with vehicle; ##, p<0.005 for Lkb1fl/fl versus Mx1-Cre/Ubc-CreERT2; Lkb1fl/fl recipients treated with rapamycin).
Figure 4
Figure 4. AMPK deficiency partially phenocopies the mitochondrial defects but not the HSC depletion observed after Lkb1 deletion
a, AMPKα1/α2 deficiency reduced phospho-AMPKα T172 and phospho-ACC levels and increased phospho-S6 levels, as expected. Each lane contained protein from 30,000 sorted cells. +/+ indicates AMPKα1/α2fl/fl cells and −/− indicates Mx1-Cre; AMPKα1/α2fl/fl cells 6 days after pIpC treatment. b, Lkb1 or AMPKα deletion did not significantly affect DCFDA staining (ROS levels) in HSCs (b, c), MPPs or WBM (c) cells 11 days after pIpC treatment. d, NAC treatment for two weeks did not rescue the depletion of Lkb1-deficient HSCs (*, p<0.05 by Student’s t-test). e, Mitochondrial DNA copy number was significantly reduced 6 days after Lkb1 or AMPKα deletion (*, p<0.05; **, p<0.005 in all panels). f, g, Mitochondrial mass significantly increased 11 days after Lkb1 deletion in HSCs, and MPPs, but not in WBM cells. AMPKα deletion significantly increased mitochondrial mass in all populations 11 days after pIpC treatment. A representative histogram shows Mitotracker staining in HSCs after Lkb1 or AMPKα deletion (f). h, ATP levels were significantly reduced in HSCs after Lkb1 or AMPKα deletion, 6 or 11 days after pIpC treatment. i, j, Mitochondrial membrane potential (Δψ) was significantly reduced after Lkb1 deletion in HSCs (i, j) and MPPs but not in WBM cells (j) or GMPs (k) 11 days after pIpC treatment. AMPKα deletion did not reduce Δψ in any cell population (i, j). l, AMPKα deletion did not cause transient expansion or rapid depletion of HSCs, but did modestly reduce HSC frequency 70 days after pIpC treatment (p<0.05). m, AMPKα-deficient HSCs were capable of long-term multilineage reconstitution 6 days after pIpC treatment, in contrast to Lkb1-deficient HSCs (Fig. 2a, b). All data (mean±standard deviation) are from 3 to 7 independent experiments.
Figure 5
Figure 5. Lkb1-deficient HSCs exhibit defects in mitotic spindles, aneuploidy, and cell death
Lkb1-deficient HSCs (6 days after pIpC) only underwent a few divisions in culture. (a, the fraction of cells that divided and (b), the total number of cells/HSC colony). Lkb1-deficient HSCs entered S-phase normally in culture (c) but failed to enter or complete mitosis, perhaps due to cell death (d). e, Lkb1-deficient HSCs, but not GMPs, exhibited supernumerary centrosomes (red arrowheads) and defective mitotic spindles: α-tubulin (green) marks mitotic spindles, γ-tubulin (red) marks centrosomes, and phospho-H3 Ser10 (blue) marks M phase cells. f, g, Increased cell death within Lkb1-deficient HSC colonies but not GMP colonies based on Annexin-V (f) or wright-giemsa (g, see the cell fragments, arrowheads) staining. h-j, Cells within Lkb1-deficient LSK (Lineage-Sca-1+c-kit+) colonies, but not within GMP colonies, became aneuploid within 2 days in culture. Representative chromosome spreads of wild-type and Lkb1-deficient LSKs with 40 and 39 chromosomes, respectively (h). k, AMPKα-deficient LSK cells did not become aneuploid. All data (mean±standard deviation) are from 3-8 independent experiments, with the indicated numbers of cells scored for chromosome numbers.

Comment in

References

    1. Shackelford DB, Shaw RJ. The LKB1-AMPK pathway: metabolism and growth control in tumour suppression. Nat Rev Cancer. 2009;9:563–575. - PMC - PubMed
    1. Alessi DR, Sakamoto K, Bayascas JR. LKB1-dependent signaling pathways. Annual review of biochemistry. 2006;75:137–163. - PubMed
    1. Inoki K, Zhu T, Guan KL. TSC2 mediates cellular energy response to control cell growth and survival. Cell. 2003;115:577–590. - PubMed
    1. Corradetti MN, Inoki K, Bardeesy N, DePinho RA, Guan KL. Regulation of the TSC pathway by LKB1: evidence of a molecular link between tuberous sclerosis complex and Peutz-Jeghers syndrome. Genes Dev. 2004;18:1533–1538. - PMC - PubMed
    1. Gwinn DM, et al. AMPK phosphorylation of raptor mediates a metabolic checkpoint. Mol Cell. 2008;30:214–226. - PMC - PubMed

Publication types

MeSH terms