. 2010 Dec;6(4):175-193.
doi: 10.1007/s12014-010-9058-8. Epub 2010 Sep 30.

Urine Peptidomic and Targeted Plasma Protein Analyses in the Diagnosis and Monitoring of Systemic Juvenile Idiopathic Arthritis

Urine Peptidomic and Targeted Plasma Protein Analyses in the Diagnosis and Monitoring of Systemic Juvenile Idiopathic Arthritis

Xuefeng B Ling et al. Clin Proteomics. 2010 Dec.

Abstract

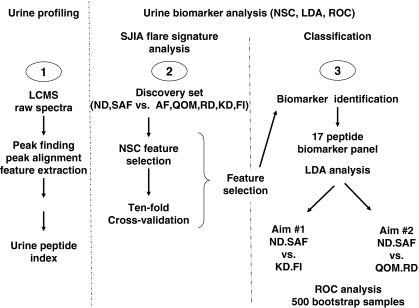
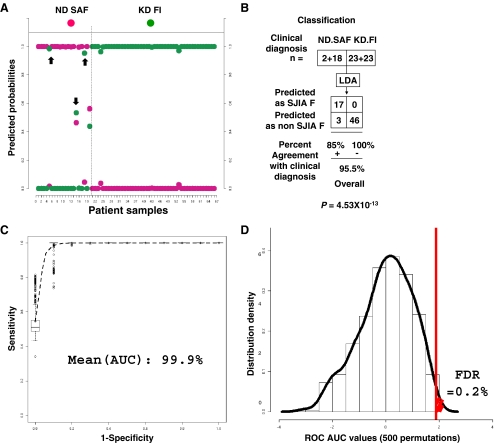
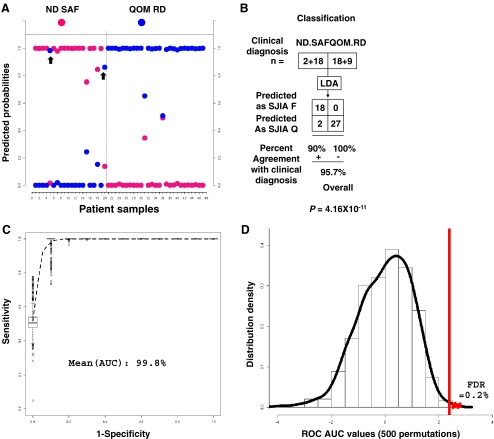
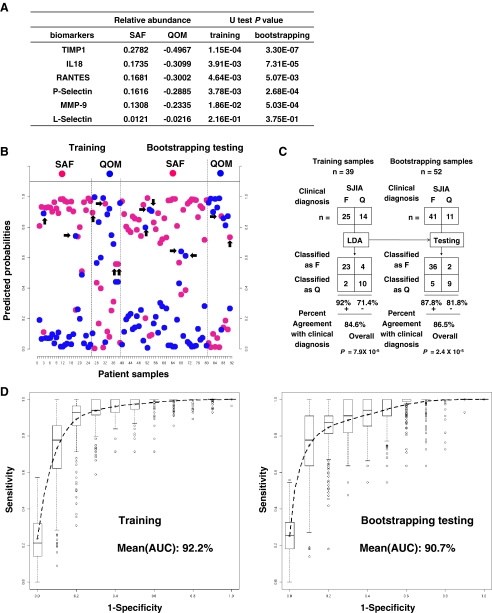
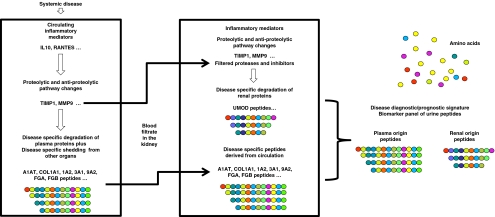
PURPOSE: Systemic juvenile idiopathic arthritis is a chronic pediatric disease. The initial clinical presentation can mimic other pediatric inflammatory conditions, which often leads to significant delays in diagnosis and appropriate therapy. SJIA biomarker development is an unmet diagnostic/prognostic need to prevent disease complications. EXPERIMENTAL DESIGN: We profiled the urine peptidome to analyze a set of 102 urine samples, from patients with SJIA, Kawasaki disease (KD), febrile illnesses (FI), and healthy controls. A set of 91 plasma samples, from SJIA flare and quiescent patients, were profiled using a customized antibody array against 43 proteins known to be involved in inflammatory and protein catabolic processes. RESULTS: We identified a 17-urine-peptide biomarker panel that could effectively discriminate SJIA patients at active, quiescent, and remission disease states, and patients with active SJIA from confounding conditions including KD and FI. Targeted sequencing of these peptides revealed that they fall into several tight clusters from seven different proteins, suggesting disease-specific proteolytic activities. The antibody array plasma profiling identified an SJIA plasma flare signature consisting of tissue inhibitor of metalloproteinase-1 (TIMP1), interleukin (IL)-18, regulated upon activation, normal T cell expressed and secreted (RANTES), P-Selectin, MMP9, and L-Selectin. CONCLUSIONS AND CLINICAL RELEVANCE: The urine peptidomic and plasma protein analyses have the potential to improve SJIA care and suggest that SJIA urine peptide biomarkers may be an outcome of inflammation-driven effects on catabolic pathways operating at multiple sites. ELECTRONIC SUPPLEMENTARY MATERIAL: The online version of this article (doi:10.1007/s12014-010-9058-8) contains supplementary material, which is available to authorized users.


Figures

Fig. 1
Fig. 1
Schematic of the experimental design to discover an SJIA systemic flare urine peptide signature. Long-term goals: Aim #1, identification of diagnostic urine peptide profile that distinguishes new onset SJIA patients from other systemic inflammatory states, including Kawasaki disease (KD) and febrile illness (FI). Aim #2, prediction of impending flare during quiescent periods of SJIA
Fig. 2
Fig. 2
Evaluation of the 17-urine-peptide biomarker panel as a classifier of SJIA versus systemic inflammation from Kawasaki disease or acute febrile illness. a A logistic regression model was used to find a panel-based algorithm that minimizes the total classification error discriminating SJIA systemic disease from inflammation due to KD/FI. The maximum estimated probabilities for each of the wrongly classified samples, are labeled with arrows. b A modified 2 × 2 contingency table shows the percentage of classifications that agreed with clinical diagnosis. c The discriminant analysis-derived prediction scores for each sample were used to construct a receiver operating characteristic (ROC) curve; 500 testing data sets, generated by bootstrapping, from the SJIA systemic flare, KD, and FI data were used to derive estimates of standard errors and confidence intervals for our ROC analysis. The plotted ROC curve is the vertical average of the 500 bootstrapping runs, and the box and whisker plots show the vertical spread around the average. d Distribution of the standardized ROC AUC values of the 500 falsely discovered panels upon the 500 class-label permutated data set of the cohort of SJIA F and KD/FI urine peptidomes. Examining all the 500 falsely discovered biomarker panel ROC AUC values, the number of falsely discovered same-size panels that have ROC AUC values greater than that of the original urine biomarker panel (represented by the red vertical line) dividing the total number of the “falsely discovered” biomarker panels led to the estimation of false discovery rate FDR
Fig. 3
Fig. 3
Evaluation of the 17-peptide biomarker panel as a classifier of active SJIA versus inactive (quiescent or remitted) SJIA. a A logistic regression model was used to find a panel-based algorithm that minimizes the total classification error discriminating active systemic SJIA from inactive SJIA. The maximum estimated probabilities for each of the wrongly classified samples, are labeled with arrows. b A modified 2 × 2 contingency table shows the percentage of classifications that agreed with clinical diagnosis. c The discriminant analysis-derived prediction scores for each sample were used to construct a receiver operating characteristic (ROC) curve; 500 testing data sets, generated by bootstrapping, from the SJIA systemic flare, and inactive SJIA data were used to derive estimates of standard errors and confidence intervals for our ROC analysis. The plotted ROC curve is the vertical average of the 500 bootstrapping runs, and the box and whisker plots show the vertical spread around the average. d Distribution of the standardized ROC AUC values of the 500 falsely discovered panels upon the 500 class-label permutated data set of the cohort of SJIA F and QOM/RD urine peptidomes. Examining all the 500 falsely discovered biomarker panel ROC AUC values, the number of falsely discovered same-size panels that have ROC AUC values greater than that of the original urine biomarker panel (represented by the red vertical line) dividing the total number of the “falsely discovered” biomarker panels led to the estimation of false discovery rate FDR
Fig. 4
Fig. 4
Identification of six plasma proteins as a SJIA plasma flare panel. a All of the six plasma biomarker proteins are of higher abundance in SJIA flare. Relative abundance: the nearest shrunken centroid values [32] have been utilized to represented the relative abundance of biomarkers in either SJIA F or Q patient class. b A logistic regression model was used to find a panel-based algorithm that minimizes the total classification error discriminating SJIA F from Q. The maximum estimated probabilities for each of the wrongly classified samples, are labeled with arrows. c A modified 2 × 2 contingency table shows the percentage of classifications that agreed with clinical diagnosis. d The discriminant analysis-derived prediction scores for each sample were used to construct a receiver operating characteristic (ROC) curve; 500 testing data sets, generated by in silico bootstrapping, from the SJIA F and Q, both the training and the experimentally bootstrapped, data were used to derive estimates of standard errors and confidence intervals for our ROC analysis. The plotted ROC curve is the vertical average of the 500 bootstrapping runs, and the box and whisker plots show the vertical spread around the average
Fig. 5
Fig. 5
Current model: SJIA urine peptide biomarkers reflect changes in expression of inflammatory mediators and proteolytic and anti-proteolytic activities during active SJIA

References

    1. Cassidy JT, Levinson JE, Brewer EJ., Jr The development of classification criteria for children with juvenile rheumatoid arthritis. Bull Rheum Dis. 1989;38:1–7. - PubMed
    1. Sandborg C, Holmes TH, Lee T, et al. Candidate early predictors for progression to joint damage in systemic juvenile idiopathic arthritis. J Rheumatol. 2006;33:2322–2329. - PubMed
    1. Modesto C, Woo P, Garcia-Consuegra J, et al. Systemic onset juvenile chronic arthritis, polyarticular pattern and hip involvement as markers for a bad prognosis. Clin Exp Rheumatol. 2001;19:211–217. - PubMed
    1. Schneider R, Lang BA, Reilly BJ, et al. Prognostic indicators of joint destruction in systemic-onset juvenile rheumatoid arthritis. J Pediatr. 1992;120:200–205. doi: 10.1016/S0022-3476(05)80427-5. - DOI - PubMed
    1. Singh-Grewal D, Schneider R, Bayer N, Feldman BM. Predictors of disease course and remission in systemic juvenile idiopathic arthritis: significance of early clinical and laboratory features. Arthritis Rheum. 2006;54:1595–1601. doi: 10.1002/art.21774. - DOI - PubMed