. 2010 Nov 29;5(11):e15497.
doi: 10.1371/journal.pone.0015497.

Transgenic miR132 alters neuronal spine density and impairs novel object recognition memory

Affiliations

Transgenic miR132 alters neuronal spine density and impairs novel object recognition memory

Katelin F Hansen et al. PLoS One. .

Abstract

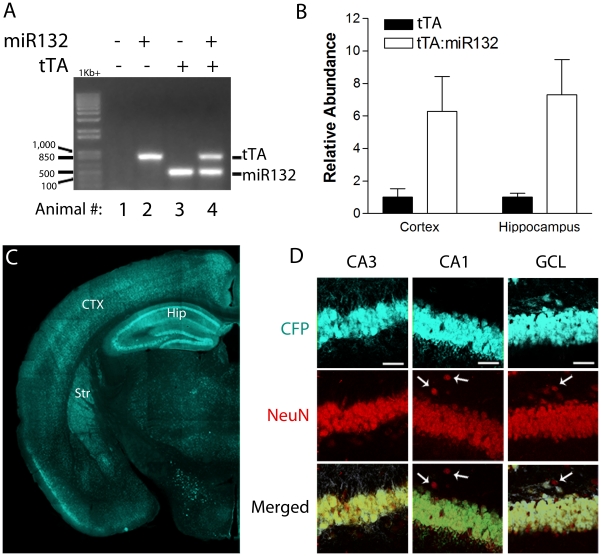
Inducible gene expression plays a central role in neuronal plasticity, learning, and memory, and dysfunction of the underlying molecular events can lead to severe neuronal disorders. In addition to coding transcripts (mRNAs), non-coding microRNAs (miRNAs) appear to play a role in these processes. For instance, the CREB-regulated miRNA miR132 has been shown to affect neuronal structure in an activity-dependent manner, yet the details of its physiological effects and the behavioral consequences in vivo remain unclear. To examine these questions, we employed a transgenic mouse strain that expresses miR132 in forebrain neurons. Morphometric analysis of hippocampal neurons revealed that transgenic miR132 triggers a marked increase in dendritic spine density. Additionally, miR132 transgenic mice exhibited a decrease in the expression of MeCP2, a protein implicated in Rett Syndrome and other disorders of mental retardation. Consistent with these findings, miR132 transgenic mice displayed significant deficits in novel object recognition. Together, these data support a role for miR132 as a regulator of neuronal structure and function, and raise the possibility that dysregulation of miR132 could contribute to an array of cognitive disorders.


Conflict of interest statement

Competing Interests: The authors have declared that no competing interests exist.

Figures

Figure 1
Figure 1. miR132/CFP transgene expression.
(A) PCR-based genotyping results for the tTA and miR132; of note, only mouse #4 contains both the tTA and miR132 transgenes. PCR reactions were run in a 1% agarose gel and visualized using ethidium bromide. (B) To confirm miR132 overexpression in tTA::miR132 mice, total hippocampal and cortical RNA was isolated, reverse-transcribed, and the miR132 cDNA was profiled via real-time PCR. Normalized mature miR132 levels are shown as mean ±SEM, compared to nontransgenic controls (NT: n = 3 animals per condition). Data were normalized to RNU6B_2 cDNA levels. Representative transgene expression in vivo. (C) Coronal brains sections were immunolabeled for the CFP transgene marker. Note the robust transgene expression within the cortex (CTX), hippocampus (Hip) and striatum (Str). (D) Double immunofluorescent labeling for CFP and NeuN reveals that hippocampal excitatory neurons of the GCL and the CA1 and CA3 sublayers express the transgene. Arrows denote the location of nontransgenic neurons adjacent to the excitatory cell layers. Scale bars: 50 µm.
Figure 2
Figure 2. Hippocampal expression of Thy1-GFP.
(A) Representative GFP fluorescent immunolabeling of the dorsal hippocampus. A limited subset of CA1 pyramidal neurons and granule cells express the GFP transgene. GCL, granule cell layer; CA1, hippocampal subfield; H, hilus. Framed CA1 pyramidal cell is shown at higher magnification (B), as well as a confocal image of a CA1 dendrite (C). (D) Immunolabeling for TRE-regulated CFP expression in a tTA::miR132 transgenic mouse. At the antibody concentration used to reveal Thy-1 driven GFP expression (presented in A), minimal expression of CFP was detected. (E) As a further control, wild type (WT) tissue was immunolabeled using the GFP antibody: minimal non-specific labeling was detected. Of note, all images presented here (except for the confocal image in C) used identical data collection and analysis settings. Scale bars: 200 µm in A, 100 µm in B, 10 µm in C, 200 µm in D.
Figure 3
Figure 3. Transgenic miR132 affects neuronal morphology.
(A) Representative confocal images of CA1 pyramidal neuron basal dendrites from tTA::miR132 transgenic and tTA monotransgenic tissue. Note the increased spine density in the tTA::miR132 dendrite compared the tTA transgenic mouse. (B) Graphical representation of the mean ± SEM spine density. **P<0.01, two-tailed t-test, n = 6 animals for each group. Please see the Methods section for a description of the quantification methods. Scale bar: 10 µm.
Figure 4
Figure 4. Decreased MeCP2 expression in tTA::miR132 mice.
A and B: Top panels) Representative immunohistochemical labeling for MeCP2 in the dorsal hippocampus of tTA monotransgenic (A) and tTA::miR132 bitransgenic (B) mice. Relative to tTA littermates, mice over-expressing miR132 showed a decrease in MeCP2 expression within the excitatory cell layers of the hippocampus. Scale bar: 200 µm. Middle and bottom panels) High magnification images of MeCP2 labeling within area CA1 and the GCL are presented. Scale bar: 100 µm. (C) Quantitative analysis of the mean ± SEM MeCP2 expression in area CA1 and the GCL. Of note, MeCP2 expression was significantly reduced in tTA::miR132 mice (n = 7) compared to monotransgenic controls (n = 8) (**P<0.01, *P<0.05). (D) Western analysis of biological replicates (two animals per condition) confirming the reduction in MeCP2 expression in tTA::miR132 mice, along with quantitative densitometric analysis relative to endogenous ERK1 levels (E), presented as mean ± SEM (n = 3) (*P<0.05).
Figure 5
Figure 5. Decreased memory capability in mice over expressing miR132.
Memory in tTA::miR132 bitransgenic mice was measured by novel object recognition. In contrast to monotransgenic littermates (tTA and miR132), which spent more time exploring novel objects than familiar ones, tTA::miR132 mice showed no significant capacity for object discrimination. Data are presented as mean discrimination ratio ±SEM, ANOVA F(2,15)  = 7.351, *p<.006, n = 6 for each group.

References

    1. Ambros V. The functions of animal microRNAs. Nature. 2004;431:350–355. - PubMed
    1. Lee RC, Feinbaum RL, Ambros V. The C. elegans heterochronic gene lin-4 encodes small RNAs with antisense complementarity to lin-14. Cell. 1993;75:843–854. - PubMed
    1. Wightman B, Ha I, Ruvkun G. Posttranscriptional regulation of the heterochronic gene lin-14 by lin-4 mediates temporal pattern formation in C. elegans. Cell. 1993;75:855–862. - PubMed
    1. Lagos-Quintana M, Rauhut R, Yalcin A, Meyer J, Lendeckel W, et al. Identification of tissue-specific microRNAs from mouse. Curr. 2002;Biol12:735–739. - PubMed
    1. Kim J, Krichevsky A, Grad Y, Hayes GD, Kosik KS, et al. Identification of many microRNAs that copurify with polyribosomes in mammalian neurons. Proc Natl Acad Sci. 2004;101:360–365. - PMC - PubMed

Publication types

MeSH terms