. 2010 Nov 29;5(11):e15545.
doi: 10.1371/journal.pone.0015545.

The taxonomic and functional diversity of microbes at a temperate coastal site: a 'multi-omic' study of seasonal and diel temporal variation

Affiliations

The taxonomic and functional diversity of microbes at a temperate coastal site: a 'multi-omic' study of seasonal and diel temporal variation

Jack A Gilbert et al. PLoS One. .

Abstract

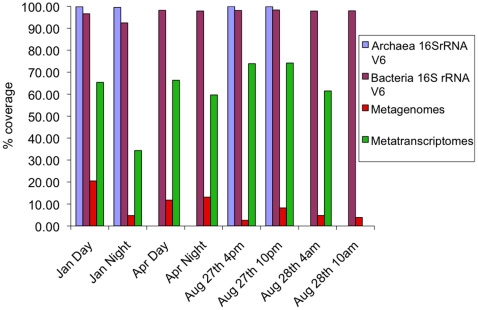
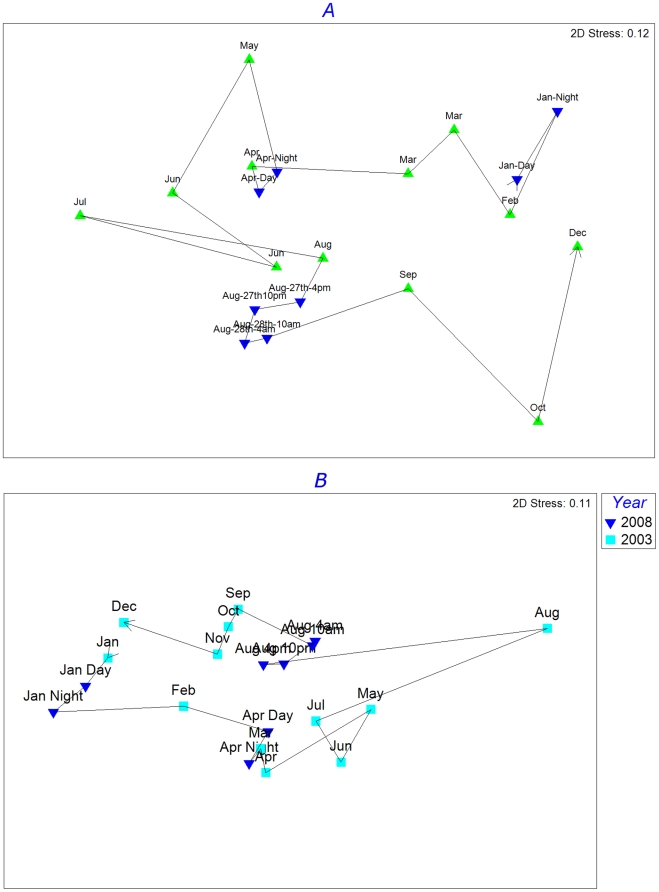
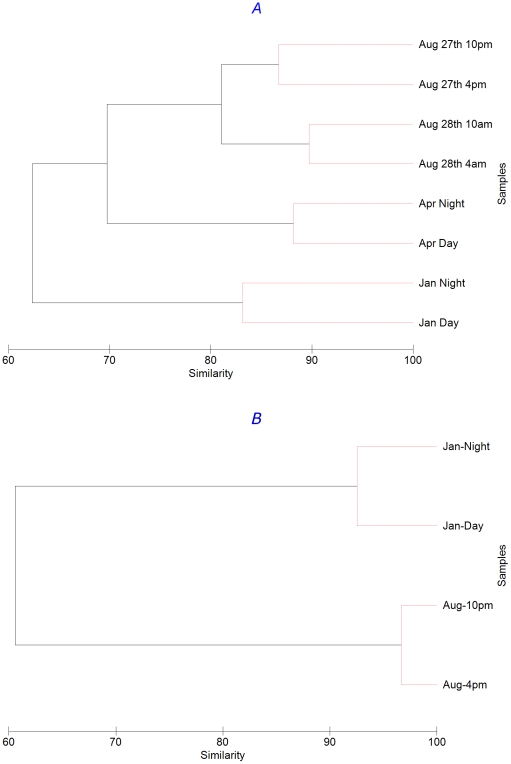
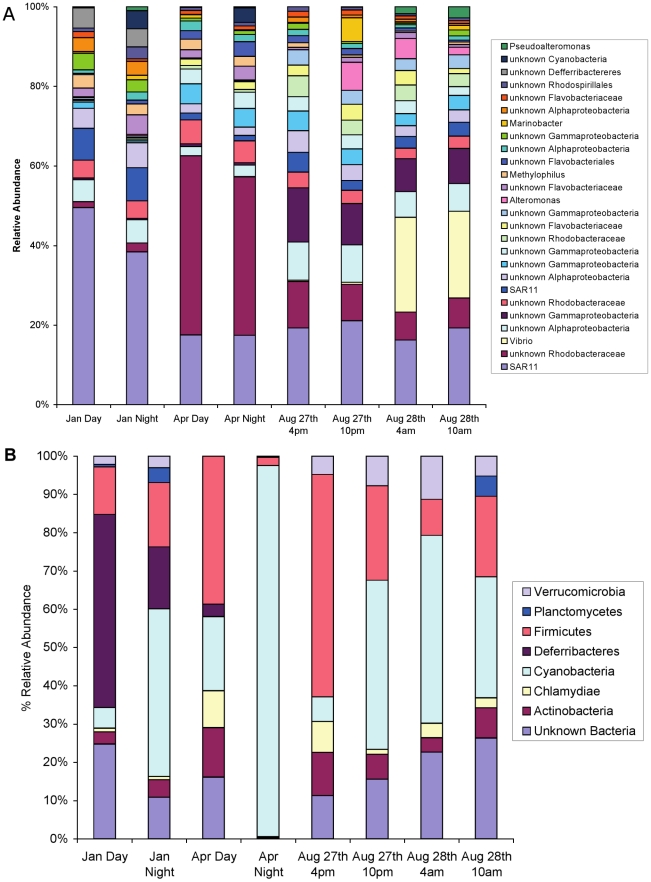
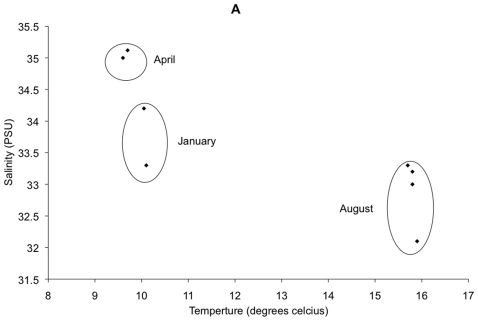
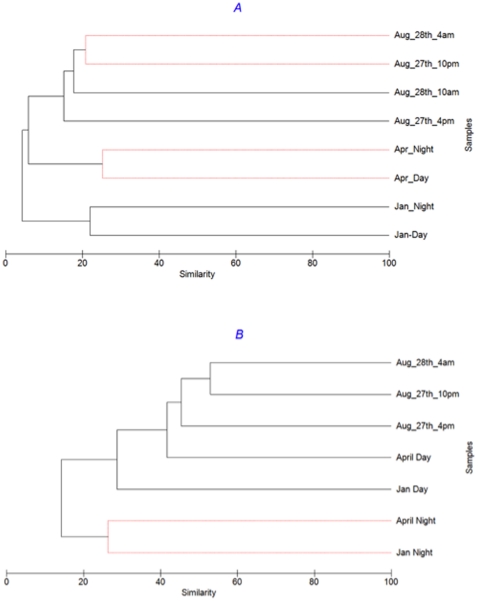
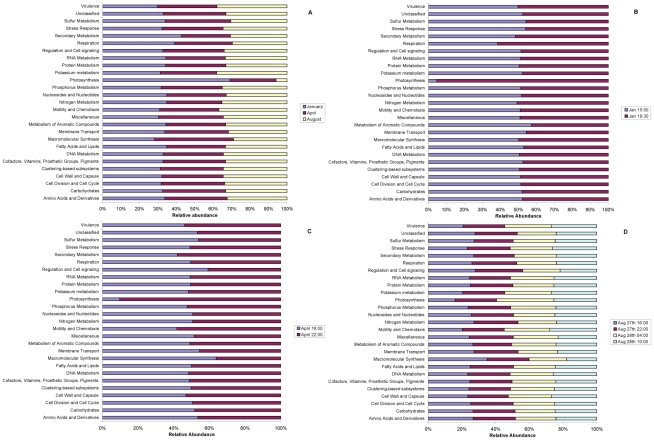
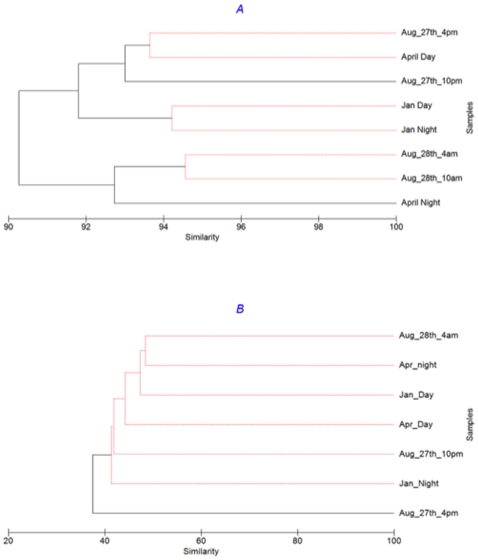
How microbial communities change over time in response to the environment is poorly understood. Previously a six-year time series of 16S rRNA V6 data from the Western English Channel demonstrated robust seasonal structure within the bacterial community, with diversity negatively correlated with day-length. Here we determine whether metagenomes and metatranscriptomes follow similar patterns. We generated 16S rRNA datasets, metagenomes (1.2 GB) and metatranscriptomes (157 MB) for eight additional time points sampled in 2008, representing three seasons (Winter, Spring, Summer) and including day and night samples. This is the first microbial 'multi-omic' study to combine 16S rRNA amplicon sequencing with metagenomic and metatranscriptomic profiling. Five main conclusions can be drawn from analysis of these data: 1) Archaea follow the same seasonal patterns as Bacteria, but show lower relative diversity; 2) Higher 16S rRNA diversity also reflects a higher diversity of transcripts; 3) Diversity is highest in winter and at night; 4) Community-level changes in 16S-based diversity and metagenomic profiles are better explained by seasonal patterns (with samples closest in time being most similar), while metatranscriptomic profiles are better explained by diel patterns and shifts in particular categories (i.e., functional groups) of genes; 5) Changes in key genes occur among seasons and between day and night (i.e., photosynthesis); but these samples contain large numbers of orphan genes without known homologues and it is these unknown gene sets that appear to contribute most towards defining the differences observed between times. Despite the huge diversity of these microbial communities, there are clear signs of predictable patterns and detectable stability over time. Renewed and intensified efforts are required to reveal fundamental deterministic patterns in the most complex microbial communities. Further, the presence of a substantial proportion of orphan sequences underscores the need to determine the gene products of sequences with currently unknown function.


Conflict of interest statement

Competing Interests: Jack A. Gilbert is a PLoS ONE Academic Editor. The authors have declared that no competing interests exist.

Figures

Figure 1
Figure 1. Good's estimate of coverage for bacterial and archaeal 16S rRNA V6 sequences resampled to 4,070 reads per sample (the smallest dataset), and for metagenomic and metatranscriptomic samples resampled to 66,529 (the smallest dataset).
Values in Table 2.
Figure 2
Figure 2. Non-parametric multidimensional scaling plot of similarities among 12 monthly sampling points from (A) 2008 and (B) 2003 (Gilbert et al., 2010) combined with the eight time points from the current study, based on square root transformed 16S rRNA V6-derived bacterial abundances and the Bray-Curtis similarity measure.
Blue: samples from the current study; green: samples from the previous study. The line links adjacent samples in time from January to December. Day and night samples are shown in chronological order with day first and night second.
Figure 3
Figure 3. Bacterial (A) and archaeal (B) community comparison for each time point examined using group-average clustering of data from Bray-Curtis similarity matrices.
All samples were randomly-resampled to 4070 sequences; abundance data were transformed by square root. SIMPROF testing has been applied to branching structure: red lines indicate branches in which re-arrangement indicates no significant difference between communities. Note, the test cannot discriminate between pairs of samples.
Figure 4
Figure 4. Percentage relative abundance of bacterial 16S rDNA V6 tags annotated to (A) all OTUs with an abundance of greater than 200 sequences and (B) all phyla with >10 sequences (sum of all 8 datasets) following removal of the Proteobacteria and Bacteroidetes.
All analyses were performed following random resampling to 4070 16S rRNA V6 sequences per dataset.
Figure 5
Figure 5. Relationship between salinity and temperature for the 8 sampling points, demonstrating that each month sampled represents different conditions.
The outlier in August is the 4pm-27th August sample.
Figure 6
Figure 6. (A) metagenomic predictions of protein families (60% clustering), (B) metatranscriptomic predictions of protein families (60% clustering).
All comparisons based on random resampling of metagenomic and metatranscriptomic datasets to 66,529 sequences (smallest dataset). SIMPROF testing has been applied to branching structure: red lines indicate branches in which re-arrangement indicates no significant difference between communities.
Figure 7
Figure 7. The average relative abundance metagenomic reads annotated to each hierarchy I subsystem from the SEED database compared between (A) each season and day and night for (B) January, (C) April and (D) August.
Each dataset was randomly re-sampled prior to analysis.
Figure 8
Figure 8. The average relative abundance of each metatranscriptomic fragments annotated to hierarchy I subsystem from the SEED database compared between (A) each season and day and night for (B) January, (C) April and (D) August.
Each dataset was randomly re-sampled prior to analysis to the smallest metatranscriptome.
Figure 9
Figure 9. Group-average clustering dendrograms comparing (A) metagenomic sequences annotated against SEED subsystems; (B) metatranscriptomic sequences annotated against SEED subsystems.

References

    1. Woese CR. Bacterial evolution. Microbiol. Rev. 1987;51:221–271. - PMC - PubMed
    1. DeLong EF, Pace NR. Environmental Diversity of Bacteria & Archaea, Systematic Biol. 2001;50:1–9. - PubMed
    1. Curtis TP, Sloan WT, Scannell JW. Estimating prokaryotic diversity and its limits. Proc. Natl. Acad Sci USA. 2002;99:10494–10499. - PMC - PubMed
    1. Wellington EM, Berry A, Krsek M. Resolving functional diversity in relation to microbial community structure in soil: exploiting genomics and stable isotope probing. Curr Opin Microbiol. 2003;6:295–301. - PubMed
    1. Handelsman J. Metagenomics: application of genomics to uncultured microorganisms. Microbiol Mol Biol Rev. 2004;68(4):669–85. - PMC - PubMed

Publication types

Substances