. 2010 Nov 24;6(11):e1001211.
doi: 10.1371/journal.ppat.1001211.

Glycosylation focuses sequence variation in the influenza A virus H1 hemagglutinin globular domain

Affiliations

Glycosylation focuses sequence variation in the influenza A virus H1 hemagglutinin globular domain

Suman R Das et al. PLoS Pathog. .

Abstract

Antigenic drift in the influenza A virus hemagglutinin (HA) is responsible for seasonal reformulation of influenza vaccines. Here, we address an important and largely overlooked issue in antigenic drift: how does the number and location of glycosylation sites affect HA evolution in man? We analyzed the glycosylation status of all full-length H1 subtype HA sequences available in the NCBI influenza database. We devised the "flow index" (FI), a simple algorithm that calculates the tendency for viruses to gain or lose consensus glycosylation sites. The FI predicts the predominance of glycosylation states among existing strains. Our analyses show that while the number of glycosylation sites in the HA globular domain does not influence the overall magnitude of variation in defined antigenic regions, variation focuses on those regions unshielded by glycosylation. This supports the conclusion that glycosylation generally shields HA from antibody-mediated neutralization, and implies that fitness costs in accommodating oligosaccharides limit virus escape via HA hyperglycosylation.


Conflict of interest statement

The authors have declared that no competing interests exist.

Figures
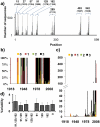
Figure 1
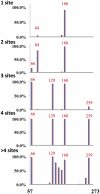
Figure 1. Distributions of the number and variability of glycosylation sites.
a) Distribution of glycosylation sites in HA sequences of H1N1 viruses. Each bar corresponds to the number of sequences with a glycosylation site at that position. Numbers on the top of the bars show the positions that tend to be more glycosylated. b) Distribution by years of the percentage of sequences that have 1, 2 or 3 glycosylation sites at the globular domain of HA (percentage). c) Distribution by years of the percentage of sequences that have 1, 2 or 3 glycosylation sites at the globular domain of HA (absolute values). d) Mean amino acids variability (quantitated by counting the number of different amino acids found at each position) +/− standard deviation in sequences with three glycosylation sites at the globular domain at positions 91,129,162, combinations of glycosylation sites of these three positions (there are no sequences with the combination of glycosylation sites at position 129 and 162), a single glycosylation or no glycosylation sites.
Figure 2
Figure 2. H1N1 HA glycosylation sites.
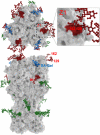
Three-dimensional model of HA as a solid surface viewed from the top and side of the trimeric molecule. Receptor sialic acid oligosaccharides associated with HA are shown in blue. Glycosylation sites are highlighted in green (conserved sites) or red and decorated with complex sugar moieties. Patterns of glycosylation at positions 91, 129 and 162 (red) are important in neutralization. The proximity of residues 129 and 162 clearly limits simultaneous glycosylation at these positions, since steric interference between the oligosaccharides would interfere with folding (zoomed region Z1).
Figure 3
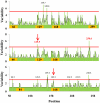
Figure 3. Relationship between amino acid variability and presence of glycosylation sites in H1 globular domain.
The plots correspond to H1 HA with the glycosylation sites indicated on the X-axis. Sequences with 2 glycosylation sites in regions 129 and 162 were not found. Green bars plot the number of amino acids present at each position in the group of isolates with specific number of oligosaccharide sites indicated, black lines are the running average of two neighboring positions. The positions and the number of different amino acid residues in each hypervariable region (in parentheses) are shown in red, i.e., those regions that have a variability of 3 standard deviations over the mean value (red line). Number of isolates available for each glycosylation stat: zero sites, 21 isolates; 1 site, position 91, 420 isolates; position 129, 10 isolates; position 162, 4 isolates; 2 sites, positions 91, 129, 34 isolates; 91, 162, 33 isolates; 3 sites, 1118 isolates.
Figure 4
Figure 4. Mean values of variability of H1 globular domain.
Mean values of variability at A) non-glycosylated regions of HA globular domain; B) glycosylation sites that are glycosylation competent (i.e. possess consensus glycosylation sites); C) regions that are glycosylated in HA but lack glycosylation sequences; D) non-glycosylated regions of HA from sequences with 3 glycosylation sequences. To reconstruct this plot, glycosylated regions considered positions 91,129 and 162 +/−3 amino acids. Confidence intervals estimated by bootstrap of 500 replicates . Schematic representations of the regions used to calculate mean values of A, B, C and D are shown on right.
Figure 5
Figure 5. Distribution of glycosylation sites in H2N2 viruses and influence on HA variability.
a) Distribution of glycosylation sites in H2N2 viruses as in Figure 1A, 83 full-length sequences were used in this analysis. b) Variability in the globular domain of H2N2 viruses, as in Figure 3.
Figure 6
Figure 6. Distribution of glycosylation sites H3N2 viruses.
H3N2 viruses were binned according to the number of glycosylation sites in the globular domain as indicated. Plotted is the percentage of viruses with glycosylation sites in the position designated. A total of 2791 H3N2 full-length sequences were used in this analysis.
Figure 7
Figure 7. Relationship between amino acid variability and presence of glycosylation sites in H3 globular domain.
Variability in the globular domain of H3N2 viruses as in Figure 3. Arrows point to glycosylation sites that do not limit variability in the adjacent residues.
Figure 8
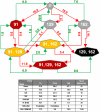
Figure 8. Schematic representation of the flow among the different states of the virus generated by the Flow Index.
Each heptagon represents a glycosylation state of H1 HAs from human viruses isolated until mid-2009 (i.e. no Swine origin HAs are represented). Based on the number of isolates with each glycosylation pattern (show in the Table below as number of sequences), we binned viruses into optimal (red), sub-optimal states (yellow), transitional (grey) and lone lethal state (black). The different states are connected by red arrows to indicate an increase in the number of glycosylation from the pre-state to the post-state or green arrows to indicate a decrease in the number of glycosylation sites. Values of arrows indicate the Flow Index (FI), i.e., the tendency of going from one pre-state to a post-state. Data for figure are provided in Table S1. The net FI acting on each state is given by the sum of the forces as calculated in the Table below, note that this correlates well with the number of isolates in a given state.
Figure 9
Figure 9. Relationship between amino acid variability and presence of glycosylation sites in Swine H1 globular domain.
The plots correspond to a) Swine-origin 2009 H1N1 HA sequences (31st March, 2010) which has 1 glycosylation site in region 91; b) Swine-origin 2009 H1N1 HA sequences (12th October, 2009) which has 1 glycosylation site in region 91; c) Human virus HAs from 1918–2008 with 1 glycosylation site in region 91; d) Swine virus HA sequences from 1918–2008 with 1 glycosylation site in region 91. The positions and the number of possible amino acids of hyper-variable regions are shown as in Figure 3.

References

    1. Skehel JJ, Wiley DC. Receptor binding and membrane fusion in virus entry: the influenza hemagglutinin. Annu Rev Biochem. 2000;69:531–569. - PubMed
    1. Russ G, Bennink JR, Bachi T, Yewdell JW. Influenza virus hemagglutinin trimers and monomers maintain distinct biochemical modifications and intracellular distribution in brefeldin A-treated cells. Cell Regul. 1991;2:549–563. - PMC - PubMed
    1. Yewdell JW, Yellen A, Bachi T. Monoclonal antibodies localize events in the folding, assembly, and intracellular transport of the influenza virus hemagglutinin glycoprotein. Cell. 1988;52:843–852. - PubMed
    1. Daniels R, Kurowski B, Johnson AE, Hebert DN. N-linked glycans direct the cotranslational folding pathway of influenza hemagglutinin. Mol Cell. 2003;11:79–90. - PubMed
    1. Wilson IA, Skehel JJ, Wiley DC. Structure of the haemagglutinin membrane glycoprotein of influenza virus at 3 A resolution. Nature. 1981;289:366–373. - PubMed

Publication types

MeSH terms