

Phenotypic consequences of copy number variation: insights from Smith-Magenis and Potocki-Lupski syndrome mouse models
- PMID: 21124890
- PMCID: PMC2990707
- DOI: 10.1371/journal.pbio.1000543
Phenotypic consequences of copy number variation: insights from Smith-Magenis and Potocki-Lupski syndrome mouse models
Abstract
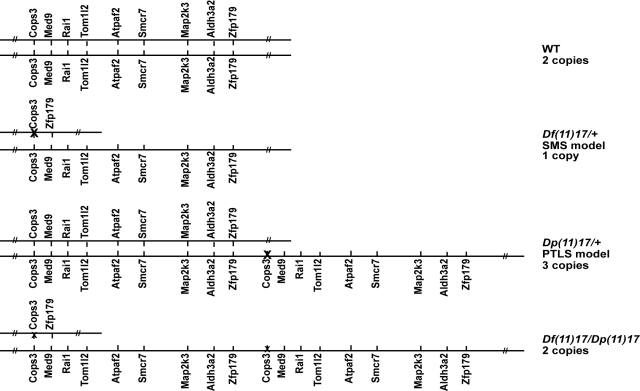
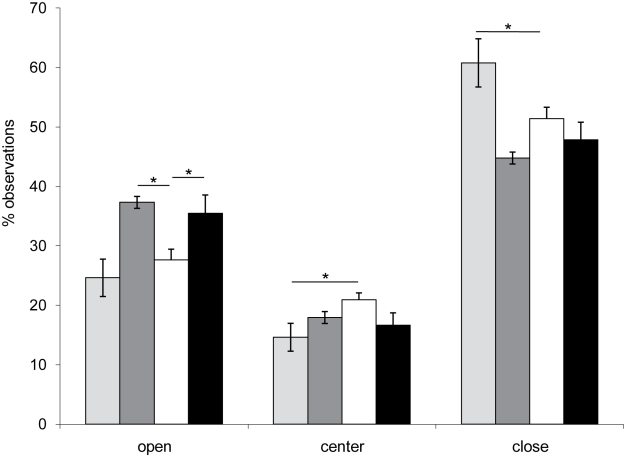
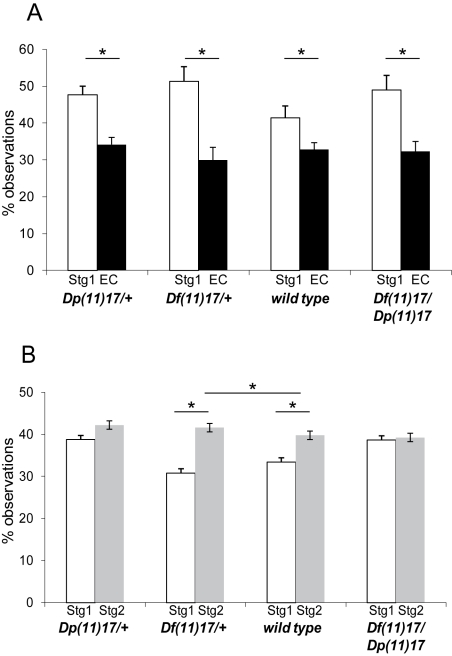
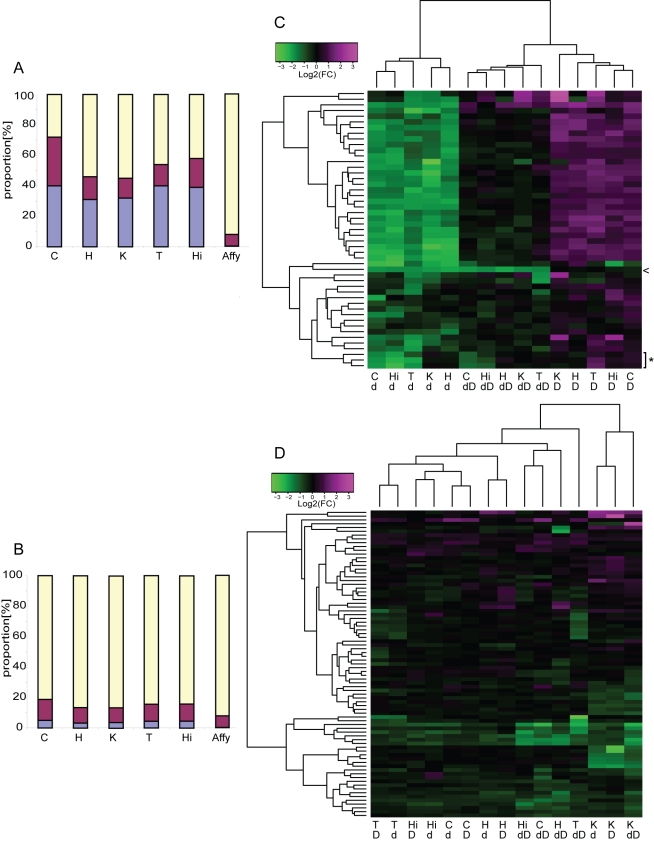
A large fraction of genome variation between individuals is comprised of submicroscopic copy number variation of genomic DNA segments. We assessed the relative contribution of structural changes and gene dosage alterations on phenotypic outcomes with mouse models of Smith-Magenis and Potocki-Lupski syndromes. We phenotyped mice with 1n (Deletion/+), 2n (+/+), 3n (Duplication/+), and balanced 2n compound heterozygous (Deletion/Duplication) copies of the same region. Parallel to the observations made in humans, such variation in gene copy number was sufficient to generate phenotypic consequences: in a number of cases diametrically opposing phenotypes were associated with gain versus loss of gene content. Surprisingly, some neurobehavioral traits were not rescued by restoration of the normal gene copy number. Transcriptome profiling showed that a highly significant propensity of transcriptional changes map to the engineered interval in the five assessed tissues. A statistically significant overrepresentation of the genes mapping to the entire length of the engineered chromosome was also found in the top-ranked differentially expressed genes in the mice containing rearranged chromosomes, regardless of the nature of the rearrangement, an observation robust across different cell lineages of the central nervous system. Our data indicate that a structural change at a given position of the human genome may affect not only locus and adjacent gene expression but also "genome regulation." Furthermore, structural change can cause the same perturbation in particular pathways regardless of gene dosage. Thus, the presence of a genomic structural change, as well as gene dosage imbalance, contributes to the ultimate phenotype.
Conflict of interest statement
The authors have declared that no competing interests exist.
Figures
Similar articles
-
Opposing phenotypes in mice with Smith-Magenis deletion and Potocki-Lupski duplication syndromes suggest gene dosage effects on fluid consumption behavior.Am J Med Genet A. 2012 Nov;158A(11):2807-14. doi: 10.1002/ajmg.a.35601. Epub 2012 Sep 18. Am J Med Genet A. 2012. PMID: 22991245 Free PMC article.
-
Reciprocal deletion and duplication of 17p11.2-11.2: Korean patients with Smith-Magenis syndrome and Potocki-Lupski syndrome.J Korean Med Sci. 2012 Dec;27(12):1586-90. doi: 10.3346/jkms.2012.27.12.1586. Epub 2012 Dec 7. J Korean Med Sci. 2012. PMID: 23255863 Free PMC article.
-
A duplication CNV that conveys traits reciprocal to metabolic syndrome and protects against diet-induced obesity in mice and men.PLoS Genet. 2012;8(5):e1002713. doi: 10.1371/journal.pgen.1002713. Epub 2012 May 24. PLoS Genet. 2012. PMID: 22654670 Free PMC article.
-
Inherited dup(17)(p11.2p11.2): expanding the phenotype of the Potocki-Lupski syndrome.Am J Med Genet A. 2014 Feb;164A(2):500-4. doi: 10.1002/ajmg.a.36287. Epub 2013 Dec 5. Am J Med Genet A. 2014. PMID: 24311450 Review.
-
Neurodevelopmental Disorders Associated with Abnormal Gene Dosage: Smith-Magenis and Potocki-Lupski Syndromes.J Pediatr Genet. 2015 Sep;4(3):159-67. doi: 10.1055/s-0035-1564443. Epub 2015 Sep 28. J Pediatr Genet. 2015. PMID: 27617127 Free PMC article. Review.
Cited by
-
TCEAL1 loss-of-function results in an X-linked dominant neurodevelopmental syndrome and drives the neurological disease trait in Xq22.2 deletions.Am J Hum Genet. 2022 Dec 1;109(12):2270-2282. doi: 10.1016/j.ajhg.2022.10.007. Epub 2022 Nov 10. Am J Hum Genet. 2022. PMID: 36368327 Free PMC article.
-
Epitranscriptomic regulation by m6A RNA methylation in brain development and diseases.J Cereb Blood Flow Metab. 2020 Dec;40(12):2331-2349. doi: 10.1177/0271678X20960033. Epub 2020 Sep 23. J Cereb Blood Flow Metab. 2020. PMID: 32967524 Free PMC article. Review.
-
A phenome-wide association study identifies effects of copy-number variation of VNTRs and multicopy genes on multiple human traits.Am J Hum Genet. 2022 Jun 2;109(6):1065-1076. doi: 10.1016/j.ajhg.2022.04.016. Epub 2022 May 23. Am J Hum Genet. 2022. PMID: 35609568 Free PMC article.
-
Mouse models of aneuploidy.ScientificWorldJournal. 2012;2012:214078. doi: 10.1100/2012/214078. Epub 2012 Jan 3. ScientificWorldJournal. 2012. PMID: 22262951 Free PMC article. Review.
-
Human subtelomeric copy number gains suggest a DNA replication mechanism for formation: beyond breakage-fusion-bridge for telomere stabilization.Hum Genet. 2012 Dec;131(12):1895-910. doi: 10.1007/s00439-012-1216-9. Epub 2012 Aug 14. Hum Genet. 2012. PMID: 22890305 Free PMC article.
References
-
- Iafrate A. J, Feuk L, Rivera M. N, Listewnik M. L, Donahoe P. K, et al. Detection of large-scale variation in the human genome. Nat Genet. 2004;36:949–951. - PubMed
-
- Sebat J, Lakshmi B, Troge J, Alexander J, Young J, et al. Large-scale copy number polymorphism in the human genome. Science. 2004;305:525–528. - PubMed
-
- Reymond A, Henrichsen C. N, Harewood L, Merla G. Side effects of genome structural changes. Curr Opin Genet Dev. 2007;17:381–386. - PubMed
Publication types
MeSH terms
Substances
Supplementary concepts
Grants and funding
LinkOut - more resources
Full Text Sources
Molecular Biology Databases
