. 2010 Nov 19;5(11):e14071.
doi: 10.1371/journal.pone.0014071.

Stimulus-specific adaptation in the auditory thalamus of the anesthetized rat

Affiliations

Stimulus-specific adaptation in the auditory thalamus of the anesthetized rat

Flora M Antunes et al. PLoS One. .

Abstract

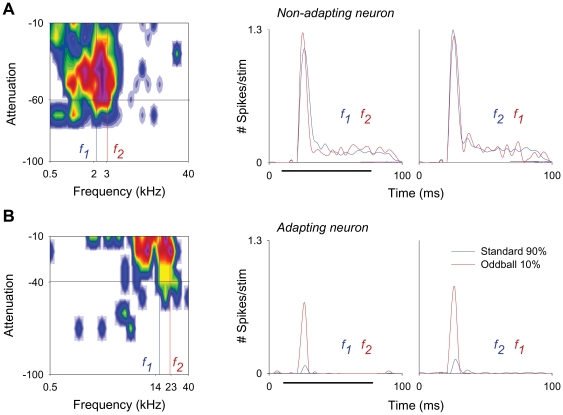
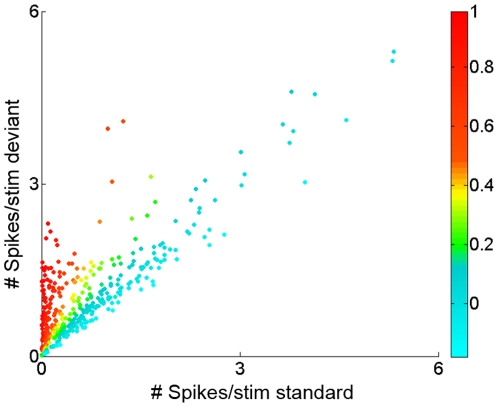
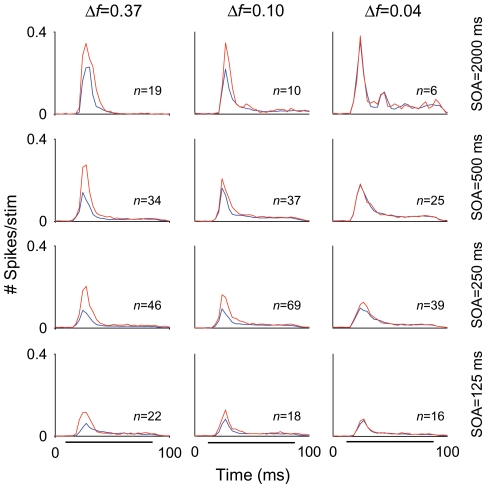
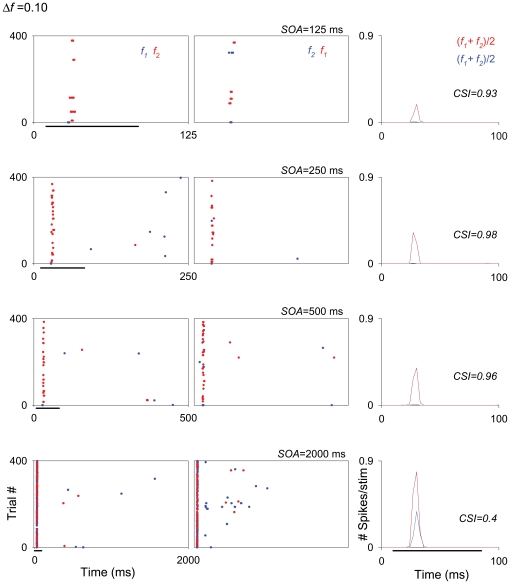
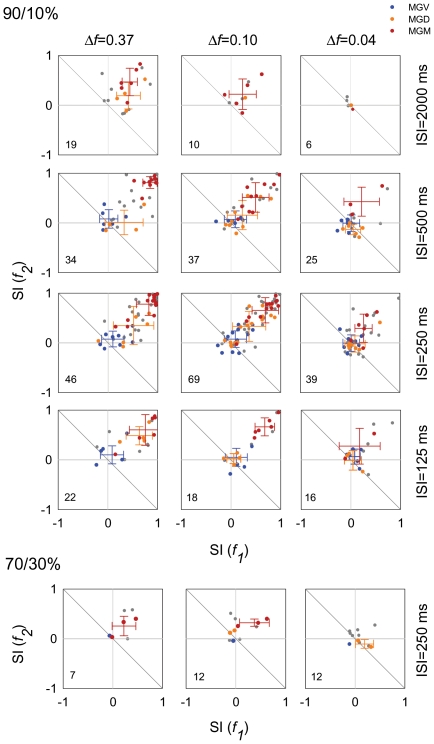
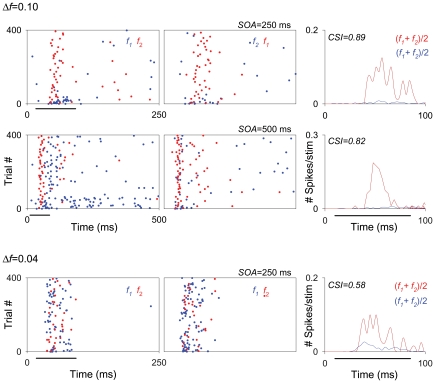
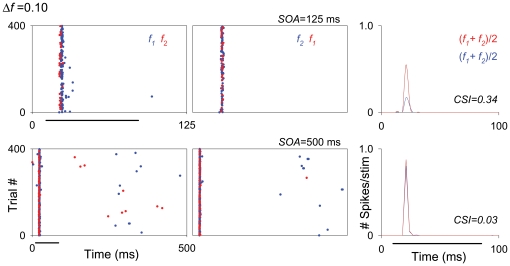
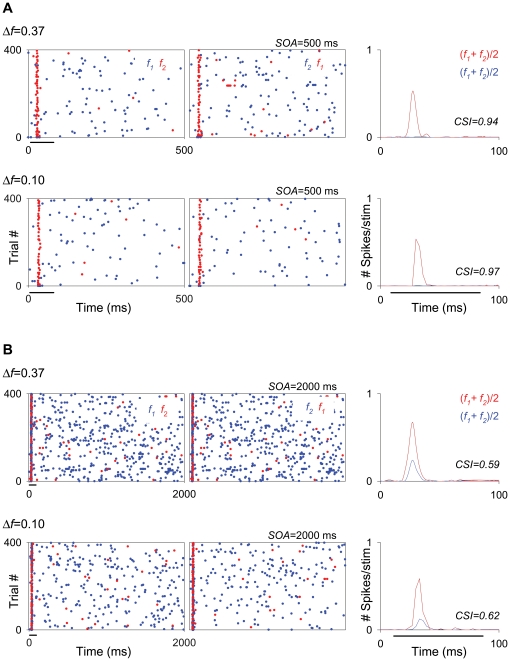
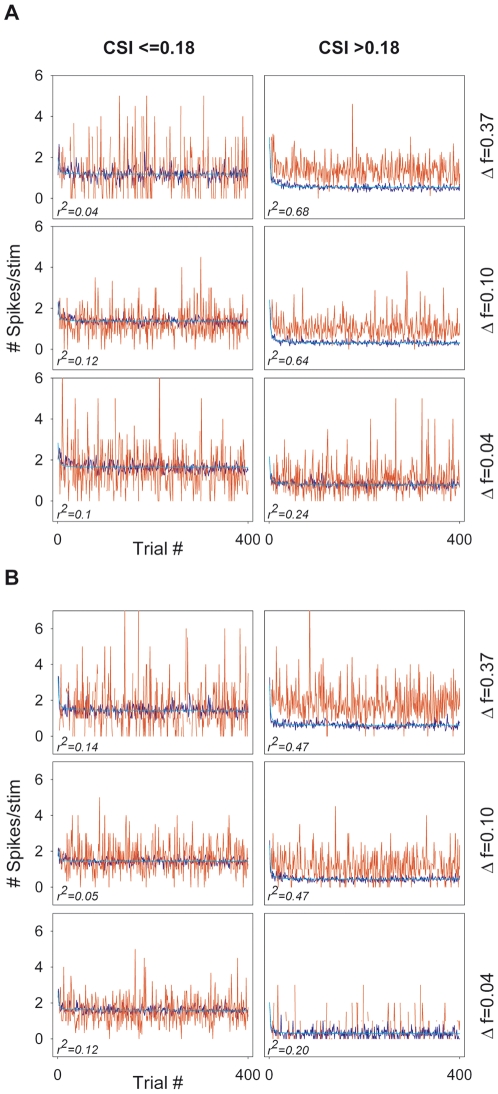
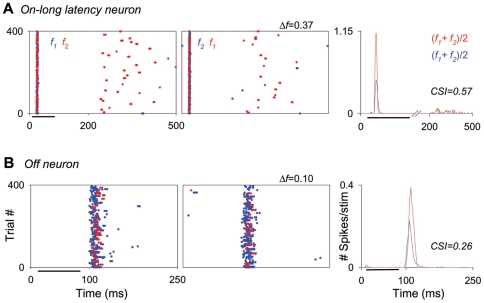
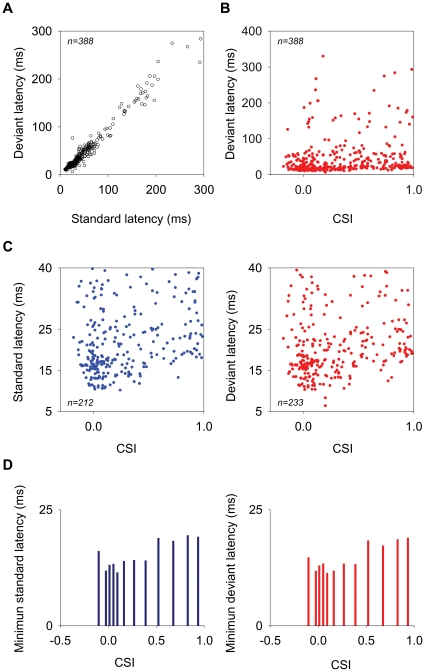
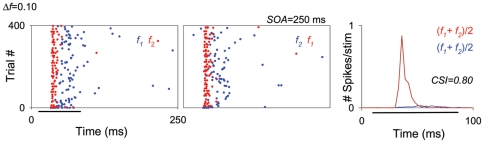
The specific adaptation of neuronal responses to a repeated stimulus (Stimulus-specific adaptation, SSA), which does not fully generalize to other stimuli, provides a mechanism for emphasizing rare and potentially interesting sensory events. Previous studies have demonstrated that neurons in the auditory cortex and inferior colliculus show SSA. However, the contribution of the medial geniculate body (MGB) and its main subdivisions to SSA and detection of rare sounds remains poorly characterized. We recorded from single neurons in the MGB of anaesthetized rats while presenting a sequence composed of a rare tone presented in the context of a common tone (oddball sequences). We demonstrate that a significant percentage of neurons in MGB adapt in a stimulus-specific manner. Neurons in the medial and dorsal subdivisions showed the strongest SSA, linking this property to the non-lemniscal pathway. Some neurons in the non-lemniscal regions showed strong SSA even under extreme testing conditions (e.g., a frequency interval of 0.14 octaves combined with a stimulus onset asynchrony of 2000 ms). Some of these neurons were able to discriminate between two very close frequencies (frequency interval of 0.057 octaves), revealing evidence of hyperacuity in neurons at a subcortical level. Thus, SSA is expressed strongly in the rat auditory thalamus and contribute significantly to auditory change detection.


Conflict of interest statement

Competing Interests: The authors have declared that no competing interests exist.

Figures

Figure 1
Figure 1. Some MGB neurons exhibit extreme levels of stimulus-specific adaptation.
Response of two neurons to pure-tone stimuli of two frequencies (f1 and f2), selected from within the frequency response area (left panels), presented in an oddball paradigm (SOA = 500 ms; Δf = 0.37). Red and blue lines in the peri-stimulus time histograms (PSTHs; second and third panels) represent the neuronal activity (number of spikes/stimulus; bin duration: 3 ms; number of bins: 168) elicited by the deviant tone (10% probability) and standard tone (90% probability) respectively, in the first block of stimuli (left PSTHs; f1 as standard, f2 as deviant) and in the second block of stimuli (right PSTHs; f2 as standard, f1 as deviant). Black horizontal lines below the PSTHs in the second panels indicate the duration of the stimulus (75 ms). The non-adapting neuron (A) has a similar response to the standard and to the deviant frequencies in both blocks of stimuli. In contrast, the adapting neuron (B) shows a much stronger response to the deviant than to the standard frequency in both blocks of stimuli.
Figure 2
Figure 2. Responses of MGB neurons to the deviant and standard tones across the CSI range.
Scatterplot of the response of all neurons to the deviant tone vs response to the standard tone, with points color-coded according to the CSI value (different colors, right color bar). Low CSI values (around 0) correspond to neurons having a similar response to the standard and deviant stimuli, i.e., non-adapting neurons. Higher CSI values reflect a stronger response to the deviant than to the standard stimulus, i.e., adaptation to the standard. CSI values close to +1 (red color) indicate near-complete cessation of the responses to the standard tone. The most strongly responding neurons tended to be non-adapting.
Figure 3
Figure 3. Responses of the population of MGB neurons across stimulation conditions.
Averaged post-stimulus time histograms (Bin duration: 3 ms) for the entire population of MGB neurons across the different conditions tested (Δf and SOA) for the 90/10% probability condition. The mean firing rate elicited by both stimuli (standard, blue lines; deviant, red lines) decreased directly with SOA (SOA = 2000, 500, 250 and 125 ms; from first to fourth rows, respectively), for the different Δfs tested (Δf = 0.37, 0.10 and 0.04; from first to third columns, respectively). Numbers in each plot indicate the number of neurons for each condition. Black horizontal lines under the PSTHs of the bottom row indicate the duration of the stimulus (75 ms).
Figure 4
Figure 4. Firing rate decreases as repetition rate increases in the MGB neurons.
Example of an MGM neuron showing strong SSA across different SOAs (125, 250, 500 and 2000 ms; from the first to the fourth rows, respectively) at the same Δf (0.10). The firing rate of this neuron decreased with decrease in SOA, it exhibited strong SSA even under extreme conditions, i.e., at the combination of a Δf = 0.10 and SOA = 2000 ms (fourth row). In this figure and subsequent ones (e.g., Figs. 6, 8, 9, 11 and 13), the plots show responses as dot rasters, which plot individual spikes (red dots indicate responses to the deviant; blue dots indicate responses to the standard). Stimulus presentations are stacked along the y-axis (trial #; 400 trials each block). The time (ms) between trials (SOA) corresponds to the x-axis and is also indicated at the top right of each pair of raster plots. Because we tested different SOAs, the plots in the different rows have different x-axis scales corresponding to the SOA tested. Left and middle columns in each row represent the two blocks tested for each frequency pair (f1/f2 as standard/deviant; and f2/f1 as standard/deviant, respectively). PSTHs in the right column show the number of spikes/stimulus averaged over the two blocks [(f1+f2)/2; blue line is standard, red line is deviant]. Black horizontal lines under the plots indicate the duration of the stimulus (75 ms). The CSI calculated for each SOA condition (each row) is noted as an inset on the PSTHs.
Figure 5
Figure 5. Analysis of SSA across MGB subdivisions in the population of neurons.
(A, B) Scatterplots of SI(f1) versus (f2), for the different Δfs (0.37, 0.10 and 0.04, from first to third columns), SOAs (2000 ms, 500 ms, 250 ms, and 125 ms, from first to fourth rows) and probabilities tested (In A, 90/10%; In B, 70 30%). Each dot in each panel represents data from one neuron. Neurons that were tested for more than one set of conditions are represented in more than one panel. Numbers in the lower left quadrant of the plots represent the number of neurons tested for each condition. Blue dots represent neurons from the MGV; yellow from the MGD and red from the MGM. Grey dots represent neurons that could not be assigned with certainty to one subdivision. Crosses indicate the mean and standard deviation for the localized neurons (blue for MGV; orange for MGD; and red for MGM). For the majority of conditions SI (fi) values lie above the reverse diagonal indicating the presence of SSA. SSA was strongest for the intermediate SOAs (205 and 500 ms), the largest Δfs (0.37 and 0.10) and the 90/10% conditions. SSA was strongest in the MGM, intermediate in the MGD and weaker in the MGV subdivision.
Figure 6
Figure 6. Some MGB neurons can discriminate between two very close frequencies.
Example of sustained responses recorded from a neuron in the MGD, exhibiting high levels of SSA when tested at two closely spaced Δfs (0.10, first and second rows; 0.04, third row). This neuron had a reduced but still high degree of adaptation for the smallest Δf tested (0.04), revealing its ability to discriminate between two very close frequencies. Details of dot rasters and PSTHs are the same as in figure 4.
Figure 7
Figure 7. Location of recorded neurons and topographical organization of SSA across the MGB.
(A) Nissl stained sections showing the MGB in the transverse plane. On the left (caudal), arrows indicate the electrolytic lesion in the MGM marking the recording site of the neuron shown in figure 9. Asterisk indicates another lesion for reference. On the right (rostral), arrows indicate an electrolytic lesion in the MGD and another one in the MGV, marking the recording site of the neuron shown in figure 8. Asterisk shows the recording track. D, dorsal; L, lateral; Calibration bar  = 500 µm. (B) Topographical organization of SSA within the MGB subdivisions, for the Δf = 0.10 at SOA = 500 ms condition. The center of tessellated polygons in the maps represents the sites at which the neurons were recorded. Each polygon was colored according to the CSI value of the neuron recorded at that site. The bar on the right represents the color scale used for the CSI range. Both the transverse projection (on left) and the horizontal projections through the MGV/MGM (section 1) and MGD (section 2) show that SSA was strongest throughout the entire MGM followed by the caudal, medial and dorsal regions of the MGD. SSA was very weak in the center of the MGV, but somewhat greater in its periphery.
Figure 8
Figure 8. High repetition rates and large Δfs can elicit SSA in some MGV neurons.
Example of an onset neuron from the MGV tested at two different SOAs (500 and 125 ms) for the same Δf (0.37). This neuron did not show SSA for the longest SOA tested (500 ms, second row) but did show some adaptation at the shortest SOA (125 ms, first row). Details of dot rasters and PSTHs are the same as in figure 4. The location of this neuron is shown in figure 7A.
Figure 9
Figure 9. Low repetition rates elicit high SSA in some MGM neurons.
Example of an onset neuron with spontaneous activity recorded in the MGM, showing strong adaptation under all of the conditions tested. (A) the neuron exhibited extreme adaptation when tested at the same SOA (500 ms) for two different Δfs (0.37 and 0.10; first and second rows, respectively). (B) the neuron showed somewhat lower adaptation when tested at the longest SOA (2000 ms; same Δfs as in A). In both A and B, the adaptation was similar for both Δf conditions. Details of dot rasters and PSTHs are the same as in figure 4. The location of this neuron is shown in figure 7A.
Figure 10
Figure 10. Time course of adaptation in the population of MGB neurons.
Average population firing rate (spikes/stimulus) versus trial number for SOA = 250 ms (A) and SOA = 500 ms (B) and the different Δfs tested, indicated to the right of each row. In both A and B, the left columns correspond to non-adapting neurons (CSI≤0.18) and right columns to adapting neurons (CSI>0.18). The response of the adapting neurons to the standard stimulus strongly declined after the first trials. A high proportion of their adaptation to the stimulus was explained by a polynomial inverse regression model [f  = y0+(a/x)], for the majority of conditions; the amount of variance explained was reduced for the smallest Δf (0.04) (r2 = 0.24, 0.20 in A and B, respectively; p <0.001 for both conditions) and was very low for the non-adapting neurons, under all conditions.
Figure 11
Figure 11. Some MGB neurons with on-late and off response types show adaptation.
(A) Example of an on-late neuron in the MGD. This neuron responded with a brief onset burst at a relatively short latency (14.8±0.4 and 16±0.5 ms; average of the mean first-spike latency for f1 and f2 when deviant and standard, respectively) followed by a long-duration burst at a much longer latency (245.8±7 ms; average of the mean first-spike latency for f1 and f2 when deviant). The neuron showed some adaptation in the onset burst but much stronger adaptation in the late burst (CSI = 0.31 and 0.98, respectively; CSI = 0.57 for the entire response time window). Details of dot rasters and PSTHs are the same as in figure 4. (B) Example of an offset neuron from the MGV that exhibited some adaptation (CSI = 0.26). Details of dot rasters and PSTHs are the same as in figure 4.
Figure 12
Figure 12. Response latencies in the MGB population of neurons.
(A) Mean first-spike latencies to the deviant versus standard stimulus for the MGB population. Latencies to the deviant were on average significantly shorter than those to the standard stimulus (Mean = 42.9 and 45.7 ms, respectively; paired t-test: t = 5.79, n = 388, d.f = 387, p<0.001). (B) Mean first-spike latencies to the deviant versus CSI. The shortest latencies o f highly adapting neurons were longer than those of non-adapting neurons. (C) Short-latency responses (<40 ms) to standard (left plot) and deviant (right plot) versus CSI. (D) The 10th percentile of the minimum latency distribution for the standard (left plot) and deviant (right plot) at different ranges of CSI. The minimal latencies of neurons with high CSI values (>0.5) were longer than those with lower CSI values, except for the most negative CSI values.
Figure 13
Figure 13. MGB neurons show shorter latencies to the deviant than to the standard stimulus.
Example of an adapting neuron that responded with a much shorter latency to the deviant than to the standard stimulus (26±0.4 and 41.1±1.6 ms; average of the mean first-spike latency between f1 and f2 when deviant and standard, respectively), for a Δf  = 0.10 at SOA = 250 ms condition. The latency of the response to the first stimulus presentation of the set was similar for both stimuli, it was even slightly shorter to the standard (24.5±0.7 and 23.5±0.2 ms, average of the first-spike latency to the first stimulus presentation between f1 and f2, when deviant and standard, respectively). Details of dot rasters and PSTHs are the same as in figure 4.

References

    1. Anderson LA, Christianson GB, Linden JF. Stimulus-specific adaptation occurs in the auditory thalamus. J Neurosci. 2009;29:7359–7363. - PMC - PubMed
    1. Baeuerle P, Von Der Behrens W, Gaese B, Kossl M. Stimulus-Specific Adaptation in the Auditory Thalamus of the Mongolian Gerbil. ARO abstr. 2009;33:646.
    1. Kraus N, McGee T, Littman T, Nicol T, King C. Nonprimary auditory thalamic representation of acoustic change. J Neurophysiol. 1994;72:1270–1277. - PubMed
    1. Malmierca MS, Cristaudo S, Perez-Gonzalez D, Covey E. Stimulus-specific adaptation in the inferior colliculus of the anesthetized rat. J Neurosci. 2009;29:5483–5493. - PMC - PubMed
    1. Nelken I, Ulanovsky N. Mismatch negativity and stimulus-specific adaptation in animal models. Journal of Psycophysiology. 2007;214-223

Publication types