. 2010 Nov 18;6(11):e1001203.
doi: 10.1371/journal.ppat.1001203.

Fcγ receptor I alpha chain (CD64) expression in macrophages is critical for the onset of meningitis by Escherichia coli K1

Affiliations

Fcγ receptor I alpha chain (CD64) expression in macrophages is critical for the onset of meningitis by Escherichia coli K1

Rahul Mittal et al. PLoS Pathog. .

Abstract

Neonatal meningitis due to Escherichia coli K1 is a serious illness with unchanged morbidity and mortality rates for the last few decades. The lack of a comprehensive understanding of the mechanisms involved in the development of meningitis contributes to this poor outcome. Here, we demonstrate that depletion of macrophages in newborn mice renders the animals resistant to E. coli K1 induced meningitis. The entry of E. coli K1 into macrophages requires the interaction of outer membrane protein A (OmpA) of E. coli K1 with the alpha chain of Fcγ receptor I (FcγRIa, CD64) for which IgG opsonization is not necessary. Overexpression of full-length but not C-terminal truncated FcγRIa in COS-1 cells permits E. coli K1 to enter the cells. Moreover, OmpA binding to FcγRIa prevents the recruitment of the γ-chain and induces a different pattern of tyrosine phosphorylation of macrophage proteins compared to IgG2a induced phosphorylation. Of note, FcγRIa(-/-) mice are resistant to E. coli infection due to accelerated clearance of bacteria from circulation, which in turn was the result of increased expression of CR3 on macrophages. Reintroduction of human FcγRIa in mouse FcγRIa(-/-) macrophages in vitro increased bacterial survival by suppressing the expression of CR3. Adoptive transfer of wild type macrophages into FcγRIa(-/-) mice restored susceptibility to E. coli infection. Together, these results show that the interaction of FcγRI alpha chain with OmpA plays a key role in the development of neonatal meningitis by E. coli K1.


Conflict of interest statement

The authors have declared that no competing interests exist.

Figures

Figure 1
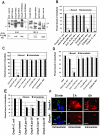
Figure 1. Depletion of MØ in newborn mice prevented the occurrence of meningitis by E. coli K1.
Newborn mice were administered α-carrageenan once a day for three days after birth. Spleens and livers were harvested, homogenized and the cells in the homogenates were subjected to flow cytometry after staining with F4/80 antibodies. Cells from untreated animals and those stained with isotype-matched antibodies were used as controls (A). The MØ-depleted animals were infected with 103 CFU of E. coli K1 by intranasal instillation and blood was collected at different post-infection times. Various dilutions of the blood were plated on agar containing rifampicin (B). Cerebrospinal fluid was collected from the same animals aseptically by cisternal puncture and inoculated into LB broth containing antibiotics (C). Blood collected from these animals was also used to measure the presence of TNF-α or IL-10 by ELISA (D). At 72 h post-infection, animals were sacrificed due to a moribund situation for ethical reasons, and the brains were harvested, fixed, paraffin sections prepared and stained with Hematoxylin and Eosin (E). Neutrophil infiltration (black arrow) was observed in the cortex and meninges in brains of WT mice along with apoptosis of neurons indicated by perinuclear halo (yellow arrows). White matter showed increased cellularity due to inflammatory exudates. Pkynotic nuclei (yellow arrows) and inflammatory cells (black arrow) were observed in the hippocampus, suggesting apoptosis of neurons. In contrast, no such pathological changes were seen in the brains of MØ-depleted mice. In some experiments, the animals were injected intraperitoneally with Evans blue at 68 h post-infection. The animals were sacrificed at 72 h the brains were harvested, then homogenized and the concentration of Evans blue determined (F). Brain homogenates from uninfected animals were used as controls. Half of the brain from each animal was homogenized and the presence of E. coli K1 determined by plating the homogenates on antibiotic containing agar (G). The data represent mean values ± SE of three separate experiments with a total of 15 animals per group. Histopathology is from one animal that is representative of similar results from the rest of the experimental group. Blood brain barrier leakage and the bacterial burden in MØ-depleted animals were statistically different when compared with the untreated and infected animals, *p<0.001 by Student's t test. Scale bars, 20 µM.
Figure 2
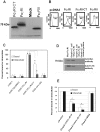
Figure 2. OmpA interaction with FcγRIa is necessary for binding to, and entry of, E. coli K1 in RAW 264.7 cells.
(A) The surface proteins of RAW 264.7 cells and THP-1 differentiated into macrophages (THP-M) were labeled with NHS-LC-Biotin and the membrane proteins prepared. OmpA+ or OmpA− E. coli, with or without treatment with 40% pooled human serum for 10 min, or HB101 were incubated with 2 µg of biotinylated proteins for 1 h, washed, the bound proteins released, and subjected to SDS-PAGE. The proteins were then transferred to a nitrocellulose and immunoblotted with streptavidin peroxidase. The blots were stripped and reprobed with anti-FcγRI antibody. (B) RAW 264.7 cells were incubated with various antibodies prior to the addition of E. coli K1. Similarly, OmpA+ E. coli were incubated with anti-OmpA antibodies for 1 h on ice prior to adding to MØ. Isotype-matched antibodies or anti-S-fimbria antibodies were used as controls. Bound and intracellular bacteria were determined by the gentamicin protection assay as described in Materials and Methods. Bound or intracellular bacteria of untreated cells were taken as 100%. (C and D) Similar studies were also performed with Zymosan coated with IgG2a and Group B streptococcus. Isotype-matched antibodies or anti-capsular antibodies were used as controls. (E) Liposomes containing OmpA or outer membrane proteins of OmpA− E. coli were incubated with RAW 264.7 cells for 30 min prior to adding the bacteria. Relative total cell bound and intracellular bacteria (by gentamicin protection assay) were determined. (F) RAW 264.7 cells were infected with OmpA+ or OmpA− E. coli for various time points, washed, fixed and differentially stained for extracellular and intracellular bacteria using anti-S-fimbria antibodies. The extracellular bacteria were stained with FITC-coupled secondary antibodies (Green) while the intracellular bacteria were stained with Cy3-coupled secondary antibodies (Red). Scale bars, 10 µM. Data shown are mean values ± SD of three separate experiments performed in triplicate. The reduction in bound or invaded bacteria was statistically significant compared with control untreated and infected cells, *p<0.001 by Student's t test.
Figure 3
Figure 3. Suppression of FcγRIa expression using shRNA prevents E. coli K1 entry into RAW 264.7 cells.
(A) RAW 264.7 cells were transfected with plasmids containing shRNA to FcγRIa or CR3, total RNA was isolated and subjected to RT-PCR using specific primers. GAPDH primers were used as internal controls. (B) FcγRIa/− and CR3/RAW cells were further subjected to flow cytometry using antibodies to FcγRI, CR3, TLR2 and TLR4. Mean fluorescence intensities were plotted after subtracting the values of isotype-matched controls. (C and D) Total cell bound and intracellular bacteria (measured by gentamicin protection assay) were determined after infecting FcγRIa/− and CR3/RAW cells with E. coli K1 or Group B streptococcus. E. coli K1 or GBS that were bound or intracellular in control cells were taken as 100%. (E) Immunocytochemistry of E. coli K1 entered into FcγRIa/− and CR3/RAW cells after differential staining as described in Materials and Methods. Scale bars, 10 µM. (F) FcγRI−/− and CR3/RAW cells were infected with E. coli K1 for varying periods, fixed and subjected to transmission electron microscopy as described in Materials and Methods. Photomicrographs at 1 h and 8 h post-infection are shown and arrows indicate vacuoles containing bacteria or empty vacuoles. Invasion experiments were performed in triplicate and were independently done three times. Data represent mean ± SD and the decrease in bound or intracellular bacteria was statistically significant when compared with control shRNA/RAW 264.7cells, *p<0.001 by Student's t test. Scale Bars 1.0 µM.
Figure 4
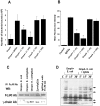
Figure 4. FcγRIa expression is sufficient to facilitate E. coli K1 invasion of COS-1 cells.
COS-1 cells were transfected with plasmids containing FcγRIa, FcγRI-CT or FcγRII and the expression of the recombinant proteins was determined by Western blotting (A) from total cell lysates or by flow cytometry (B) using anti-Myc antibody. COS-1 cells transfected with pcDNA3 were used as a control (Mock). E. coli K1 binding to, and invasion of, transfected COS-1 cells were performed as described in Materials and Methods (C). Purified Myc-FcγRIa or BSA (control) was incubated with OmpA+ or OmpA− E. coli for 1 h on ice. Bacteria were washed, the bound proteins were released and were subjected to SDS-PAGE. The proteins were transferred to a nitrocellulose and immunoblotted with anti-Myc antibodies. In separate experiments, the bound proteins were blotted with anti-FcγRIa antibodies (D). Purified Myc-FcγRIa (5 and 10 µg) or BSA (10 µg) were incubated with OmpA+ E. coli separately, washed and then added to COS-1 cells. Total cell bound and intracellular bacteria were determined (E). Binding and invasion assays were performed at least three times in triplicate and the data represent mean ± SD. The increase or decrease in binding or invasion of E. coli was statistically significant compared to controls, *p or $p<0.001 by Student's t test.
Figure 5
Figure 5. E. coli K1 binds to FcγRIa via OmpA and induces a distinct signaling.
(A) OmpA− E. coli were coated with IgG2a for 1 h on ice, washed and then added to COS-1 cells pre-treated with cytochalasin D. After one hour of incubation, the cells were washed and OmpA+ E. coli were added at an MOI of 10 and 100. The cells were incubated for 10 min, washed, and the bound OmpA− E. coli enumerated as described in Materials and Methods. (B) Peritoneal MØ pre-treated with cytochalasin D were incubated with FITC-IgG2a for 30 min, washed, and further incubated with OmpA+ or OmpA− E. coli at an MOI of 10 or 100 for 10 min. The cells were washed and subjected to flow cytometry to determine the bound levels of IgG2a. Cells without the addition of IgG2a were used as a control. (C) Immunoprecipitation of total cell lysates obtained from RAW 264.7 cells infected with OmpA+ E. coli, OmpA− E. coli or Zymosan with anti- FcγRI antibody was followed by Western blotting with antibodies to γ-chain or FcγRI. (D) Total cell lysates of RAW 264.7 cells infected with OmpA+ or OmpA− E. coli were subjected to Western blotting with anti-phospho-tyrosine antibodies. Competitive inhibition studies were performed at least four times in triplicate and the data represent mean ± SD. The decrease in the number of bacteria attached to COS-1 cells or MFI was statistically significant compared to IgG2a coated OmpA− E. coli, *p<0.001 by Student's t test.
Figure 6
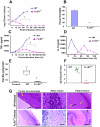
Figure 6. FcγRIa−/− mice are resistant to E. coli K1 induced meningitis.
(A) Wild type (WT) and FcγRIa−/− mice were infected intranasally at post-natal day 3 with 103 CFU of E. coli K1. At various time points blood was collected, dilutions made, and bacteria enumerated by plating on agar containing antibiotics. (B) Cerebrospinal fluid samples from experimental and control animals were collected and inoculated into LB broth containing antibiotics and incubated overnight at 37°C. Positive cultures indicate the occurrence of meningitis. (C and D) TNF-α and IL-10 concentrations in the blood of WT and FcγRIa−/− animals infected with E. coli were measured by ELISA. (E) Blood-brain barrier leakage in infected animals was measured by Evans blue extravasation method as described in Materials and Methods. (F) The bacterial load in the brains of infected animals was determined by plating brain homogenates on agar containing antibiotics. (G) Brain halves from experimental and control animals were fixed, paraffin embedded, sectioned and stained with H & E. Cortex and meninges showed severe inflammation (black arrow) along with apoptosis of neurons (yellow arrow) in the brains of WT infected mice. White matter revealed increased cellularity due to inflammatory exudate (black arrow). Neutrophil infiltration (black arrow) and apoptosis of neurons (yellow arrow) were observed in hippocampus. On the contrary, no such pathological changes were seen in the brains of FcγRIa−/− animals infected with E. coli K1. Data represent cumulative values from 15 animals in each group performed three times independently. Statistical analysis was done by Student's t test and Chi Square test. *p<0.001 indicates a significant difference compared with WT infected animals. Scale bars, 20 µM.
Figure 7
Figure 7. Alteration of surface receptor expression in MØ obtained from WT and FcγRIa−/− mice upon infection with E. coli K1.
(A) Peritoneal MØ from infected WT and FcγRIa−/− mice were isolated, stained with antibodies to FcγRI, TLR2, TLR4 and CR3, and then subjected to flow cytometry. Data are presented after subtracting the mean fluorescence intensity (MFI) of isotype-matched control. (B) The production of NO by MØ infected with E. coli K1 isolated from WT and FcγRIa−/− mice was measured as nitrite by the Griess method. (C and D) Bone marrow derived MØ (BMDMs) from FcγRIa−/− mice were transfected with FcγRIa, FcγRIa-CT or FcγRII and used for E. coli K1 binding and invasion assays. (E) Flow cytometry of FcγRIa−/−BMDMs transfected with FcγR constructs were infected with E. coli K1 for 6 h, washed and then subjected to flow cytometry after staining with antibodies to FcγRI, TLR2, TLR4, or CR3. MFI values for control-uninfected cells were subtracted from the values of infected cells and then graphed. (F) NO production was also determined in FcγRI−/− BMDMs transfected with FcγRIa, FcγRIa-CT or FcγRII at various times post-infection. All experiments were performed three times in triplicate. The increase or decrease in the surface expression was statistically significant by Student's t test, *p<0.001.
Figure 8
Figure 8. Adoptive transfer of FcγRIa+/+ MØ into FcγRIa−/− mice restored the susceptibility to E. coli K1 meningitis.
FcγRIa−/− mice were reconstituted with FcγRIa+/+ MØ by intraperitoneal injection as described in Materials and Methods. Blood was withdrawn at various time points and bacteremia levels enumerated by plating the serial dilutions on agar containing antibiotics (A). Cerebrospinal fluid obtained from the same animals as described in A were directly inoculated into LB broth containing antibiotics. Positive broth cultures were considered positive for the occurrence of meningitis (B). In addition, blood brain barrier leakage (C) and brain bacterial load (D) were determined as described in Materials and Methods. Increase in these parameters in FcγRIa+/+ MØ reconstituted mice was statistically significant compared with FcγRIa−/− MØ reconstituted animals, *p<0.001 by Student's t test. Results are representative of four independent experiments with 12 animals per group. Data represent mean ± SE.

References

    1. Hornef MW, Wick MJ, Rhen M, Normark S. Bacterial strategies for overcoming host innate and adaptive immune responses. Nat Immunol. 2002;3:1033–1040. - PubMed
    1. Sansonetti PJ. Phagocytosis, a cell biology view. J Cell Sci. 2000;113:3355–3356.
    1. Underhill DM, Ozinsky A. Phagocytosis of microbes: complexity in action. Annu Rev Immunol. 2002;20:825–852. - PubMed
    1. Koedel U, Pfister HW. Models of experimental bacterial meningitis. Role and limitations. Infect Dis Clin North Am. 1999;13:549–577. - PubMed
    1. Leib SL, Tauber MG. Pathogenesis of bacterial meningitis. Infect Dis Clin North Am. 1999;13:527–548. - PubMed

Publication types

MeSH terms