Comparative Study
. 2010 Nov 18;6(11):e1001007.
doi: 10.1371/journal.pcbi.1001007.

Using sequence-specific chemical and structural properties of DNA to predict transcription factor binding sites

Affiliations
Comparative Study

Using sequence-specific chemical and structural properties of DNA to predict transcription factor binding sites

Amy L Bauer et al. PLoS Comput Biol. .

Abstract

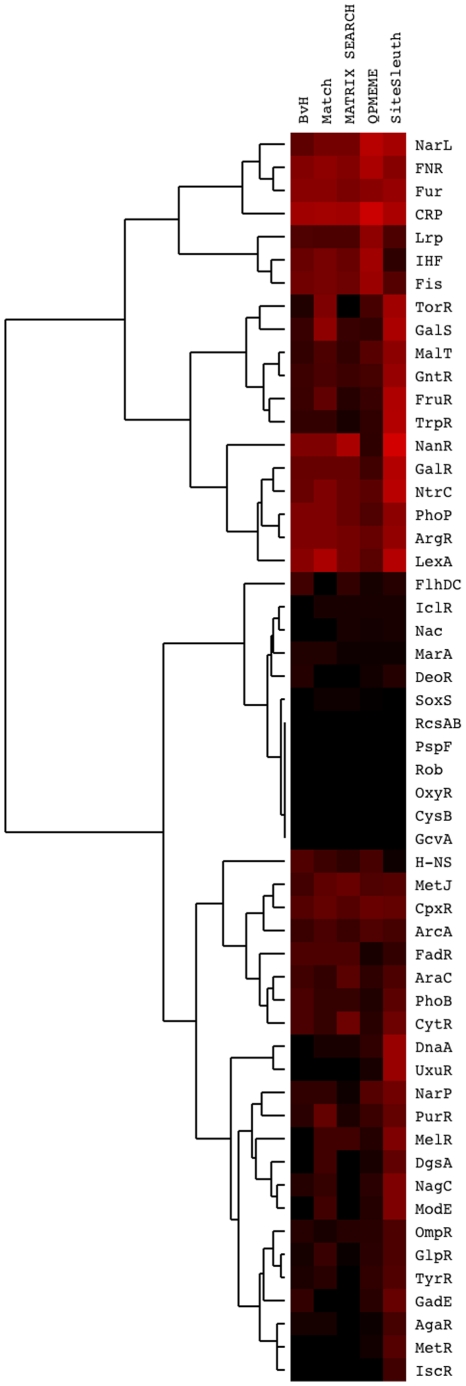
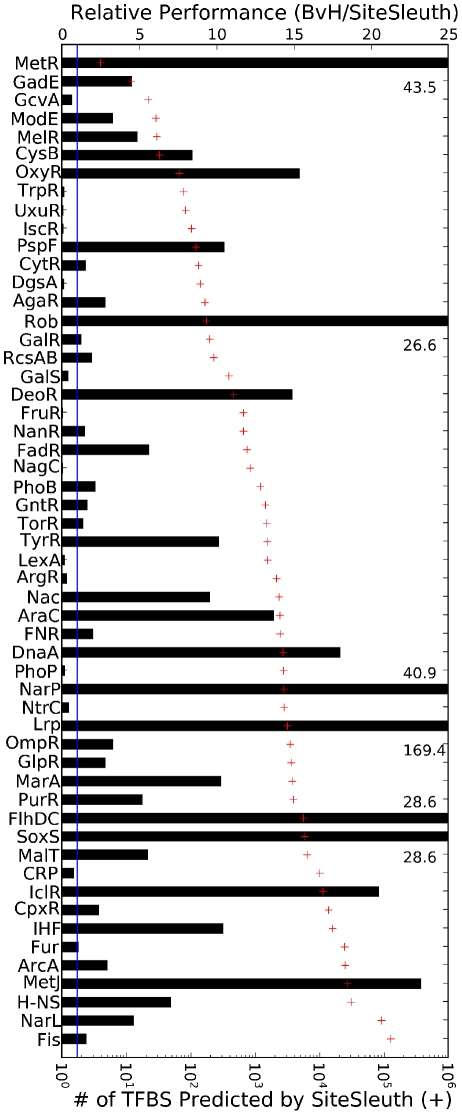
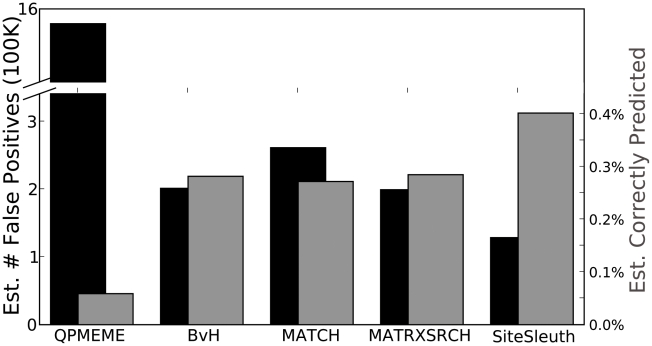
An important step in understanding gene regulation is to identify the DNA binding sites recognized by each transcription factor (TF). Conventional approaches to prediction of TF binding sites involve the definition of consensus sequences or position-specific weight matrices and rely on statistical analysis of DNA sequences of known binding sites. Here, we present a method called SiteSleuth in which DNA structure prediction, computational chemistry, and machine learning are applied to develop models for TF binding sites. In this approach, binary classifiers are trained to discriminate between true and false binding sites based on the sequence-specific chemical and structural features of DNA. These features are determined via molecular dynamics calculations in which we consider each base in different local neighborhoods. For each of 54 TFs in Escherichia coli, for which at least five DNA binding sites are documented in RegulonDB, the TF binding sites and portions of the non-coding genome sequence are mapped to feature vectors and used in training. According to cross-validation analysis and a comparison of computational predictions against ChIP-chip data available for the TF Fis, SiteSleuth outperforms three conventional approaches: Match, MATRIX SEARCH, and the method of Berg and von Hippel. SiteSleuth also outperforms QPMEME, a method similar to SiteSleuth in that it involves a learning algorithm. The main advantage of SiteSleuth is a lower false positive rate.


Conflict of interest statement

The authors have declared that no competing interests exist.

Figures

Figure 1
Figure 1. Computation of the molecular interaction potential.
The local coordinate references for base pairs associated with bases b, b+1, and b−1 are defined using the reference framework for the description of nucleic acid base-pair geometry . The volume Ω is defined as the space constrained by four planes A, B, C and D. Plane A (B) bisects Bases b and b+1 (b and b−1), and Plane C is perpendicular to Planes A and B and bisects Base b and its complementary base. Plane D marks a boundary 20 Å away from Plane C. Outside this area, the interaction energy tends to be weak (greater than −0.001 Kcal/mol). A probe is placed in Ω and the interaction energy between the DNA and the probe is calculated using the GRID software tool . A total of 31 probes, listed in Table S1, are used in these calculations. See the Methods section for more details.
Figure 2
Figure 2. Mapping of DNA sequences to feature vectors.
DNA sequences of known or potential TF binding sites are mapped to feature vectors as illustrated here for the 10-base sequence GACCTCTAGA. Red letters indicate nucleotides that are mapped to structural and chemical features and boxes indicate base pairs mapped to structural features. Step 1: map each of the ten nucleotides and its complement to eight chemical features. Step 2: map each middle base pair in the ten possible 3-mers to six geometrical base features. Step 3: for each of the nine possible 4-mers, map the two middle base pairs to six geometrical step features. For this example sequence, there are ten triplets and nine quadruplets, which result in a total of n = 274 feature vector components. A detailed description of the process of mapping DNA sequences to features is provided in the Methods section. The features associated with AGA are listed in Table S2.
Figure 3
Figure 3. Structural features depend on nucleotide environment.
These figures show the twist angle between the two base planes of a base pair in the vertical center of each of four DNA structures corresponding to the DNA sequences indicated below. All structures were obtained through MD simulations, as described in the Methods section. (A) Sequences with the same central base can have different properties in different local environments: G in GCTGGGC (left) is twisted −4.3 degrees relative to its cognate base and G in GCAGAGC (right) is twisted −20.4 degrees. (B) Sequences with different central bases can have similar structural properties: A in GCCAGGC (left) is twisted −9.5 degrees relative to its cognate base and G in GCCGGGC (right) is twisted −9.5 degrees.
Figure 4
Figure 4. Cross-validation heat map.
Heat map of cross-validation score, V, for the five methods indicated along the top for each of the 54 TFs indicated on the right. Bright red indicates a high cross-validation score, whereas black indicates V = 0 (the lowest score). The highest score is V = 1. Of the 54 TFs studied, SiteSleuth outperforms all the other methods in 28 cases, equals the next best method in 11 cases, and performs more poorly in 15 cases. The ranking of methods in order of the number of times a method outperforms all the others is as follows: SiteSleuth (28)>QPMEME (8)>MATRIX SEARCH (2) = BvH (2)>Match (0).
Figure 5
Figure 5. Bars show the relative performance (RP) of SiteSleuth compared to BvH.
The quantity RP is defined as the number of predictions given by BvH divided by the number of predictions given by SiteSleuth. The value of RP is given on the top axis. A solid line is drawn at RP = 1. RP>1 indicates that BvH predicts a greater number of TF binding sites than SiteSleuth. The number of TF binding sites predicted by SiteSleuth (+) is indicated on the bottom axis. Of the 54 TFs tested, 13 TFs have RP<1 and 41 have RP>1. Taken together with the Fis ChIP-chip data , this figure shows that BvH predicts more estimated false positives than SiteSleuth. See the main text for further discussion.
Figure 6
Figure 6. Evaluation of five computational methods using ChIP-chip characterization of Fis binding to E. coli DNA .
Black bars indicate the estimated number of false positives (left axis). Gray bars indicate the number of TF binding sites estimated to be correctly predicted divided by the total number of predictions (right axis). As described in the Methods section, the estimated number of false positives is calculated as the difference between a method's total number of predictions and the estimated number of Fis binding sites correctly predicted. SiteSleuth produces over 70,000 fewer false positives (difference between black bars for SiteSleuth and MATRIX SEARCH) and shows a 41% improvement in prediction accuracy over the next best method (compare the gray bars for MATRIX SEARCH and SiteSleuth).

References

    1. Wall ME, Hlavacek WS, Savageau MA. Design Principles for Regulator Gene Expression in a Repressible Gene Circuit. J Mol Biol. 2003;332:861–876. - PubMed
    1. Lee SK, Keasling JD. Practical pathway engineering - demonstration in integrating tools. In: Smolke CD, editor. The Metabolic Pathway Engineering Handbook: Tools and Applications. Baca Raton, FL: CRC Press; 2010. pp. 12-11–12-14.
    1. Berg O, von Hippel P. Selection of DNA binding sites by regulatory proteins. Statistical-mechanical theory and application to operators and promoters. J Mol Biol. 1987;193:723–750. - PubMed
    1. Cartharius K, Frech K, Grote K, Klocke B, Haltmeier M, et al. MatInspector and beyond: promoter analysis based on transcription factor binding sites. Bioinformatics. 2005;21:2933–2942. - PubMed
    1. Chen QK, Hertz GZ, Stormo GD. MATRIX SEARCH 1.0: a computer program that scans DNA sequences for transcriptional elements using a database of weight matrices. Comput Appl Biosci. 1995;11:563–566. - PubMed

Publication types

MeSH terms