

Modelling the evolution and spread of HIV immune escape mutants
- PMID: 21124991
- PMCID: PMC2987822
- DOI: 10.1371/journal.ppat.1001196
Modelling the evolution and spread of HIV immune escape mutants
Abstract
During infection with human immunodeficiency virus (HIV), immune pressure from cytotoxic T-lymphocytes (CTLs) selects for viral mutants that confer escape from CTL recognition. These escape variants can be transmitted between individuals where, depending upon their cost to viral fitness and the CTL responses made by the recipient, they may revert. The rates of within-host evolution and their concordant impact upon the rate of spread of escape mutants at the population level are uncertain. Here we present a mathematical model of within-host evolution of escape mutants, transmission of these variants between hosts and subsequent reversion in new hosts. The model is an extension of the well-known SI model of disease transmission and includes three further parameters that describe host immunogenetic heterogeneity and rates of within host viral evolution. We use the model to explain why some escape mutants appear to have stable prevalence whilst others are spreading through the population. Further, we use it to compare diverse datasets on CTL escape, highlighting where different sources agree or disagree on within-host evolutionary rates. The several dozen CTL epitopes we survey from HIV-1 gag, RT and nef reveal a relatively sedate rate of evolution with average rates of escape measured in years and reversion in decades. For many epitopes in HIV, occasional rapid within-host evolution is not reflected in fast evolution at the population level.
Conflict of interest statement
The authors have declared that no competing interests exist.
Figures
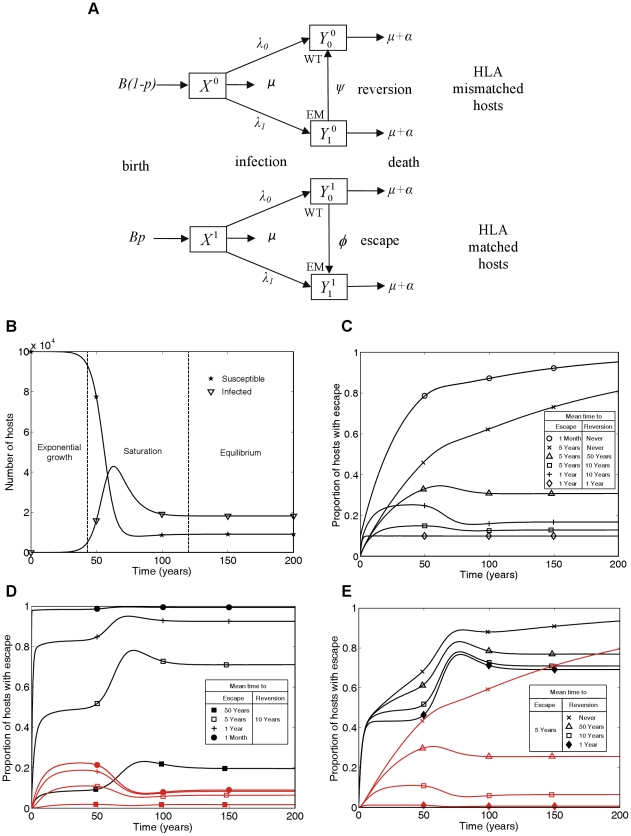
 ) and infected (
 ) hosts over time showing the three phases of the epidemic: exponential growth, saturation and equilibrium. C) Changes through time in the proportion of infected hosts with escape at a single CTL epitope for different escape and reversion rates. D and E) Changes through time in the proportion of HLA matched (black lines) and HLA mismatched (red lines) hosts infected with escape at a single CTL epitope for different escape and reversion rates. Different escape rates are compared in D) and different reversion rates are compared in E). The following initial conditions and parameters were used for these plots: X1(0) = 104, X0(0) =
  ,
,  = 0.1,
  = 0.9,
  = 0, p = 0.1, μ = 1/50 years−1, μ+α = 1/10 years−1, βc = 0.3 and B = 105
μ years−1. These parameters yield a basic reproduction number of 3, since for this model R
0 = βc/(μ+α).
= 0, p = 0.1, μ = 1/50 years−1, μ+α = 1/10 years−1, βc = 0.3 and B = 105
μ years−1. These parameters yield a basic reproduction number of 3, since for this model R
0 = βc/(μ+α).
References
-
- Phillips RE, Rowland-Jones S, Nixon DF, Gotch FM, Edwards JP, et al. Human immunodeficiency virus genetic variation that can escape cytotoxic T cell recognition. Nature. 1991;354:453–459. - PubMed
-
- Borrow P, Lewicki H, Wei X, Horwitz MS, Peffer N, et al. Antiviral pressure exerted by HIV-1-specific cytotoxic T lymphocytes (CTLs) during primary infection demonstrated by rapid selection of CTL escape virus. Nat Med. 1997;3:205–211. - PubMed
