

Comparison of the temporal programs regulating tyrosine hydroxylase and enkephalin expressions in TIDA neurons of lactating rats following pup removal and then pup return
- PMID: 21125428
- PMCID: PMC3110518
- DOI: 10.1007/s12031-010-9466-2
Comparison of the temporal programs regulating tyrosine hydroxylase and enkephalin expressions in TIDA neurons of lactating rats following pup removal and then pup return
Abstract
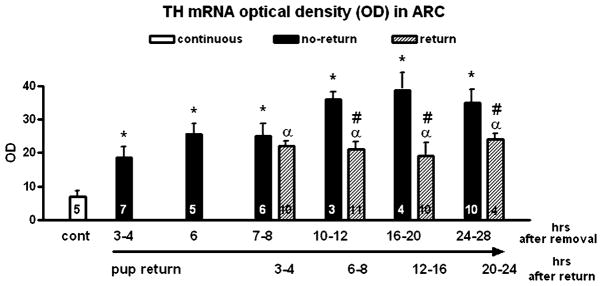
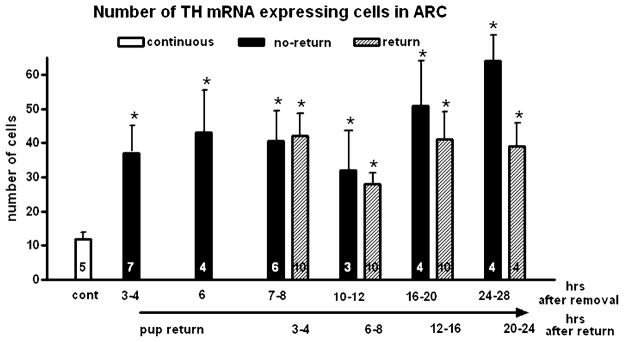
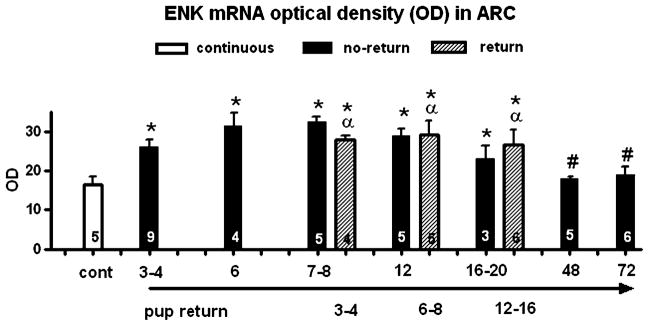
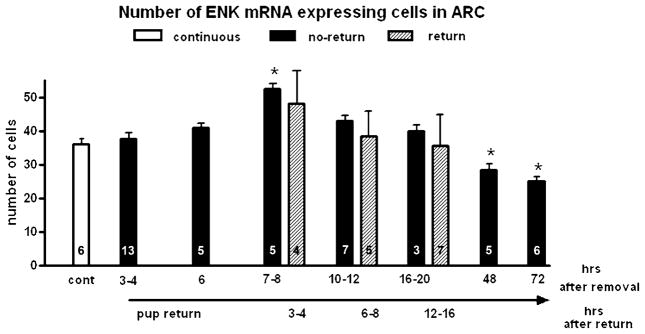
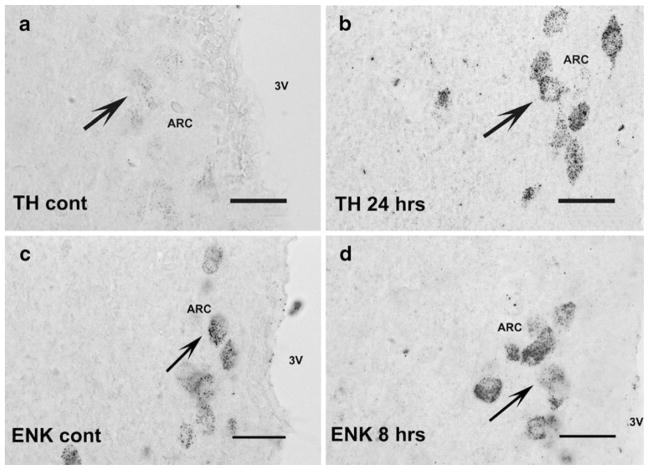
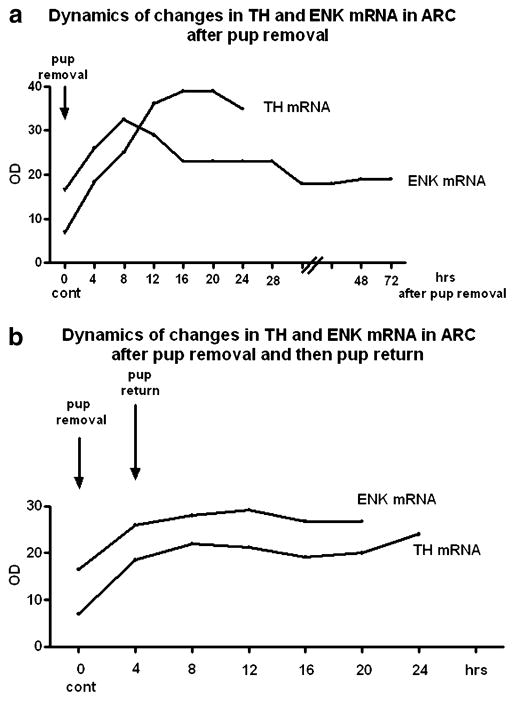
Dopamine (DA) and enkephalin (ENK) release from the tuberoinfundibular dopaminergic neurons (TIDA) into the hypophysial portal circulation is fundamentally different under non-lactating and lactating conditions. The aim of this experiment was to compare the effect of a brief interruption then resumption of suckling on the temporal program of tyrosine hydroxylase (TH; rate-limiting enzyme of dopamine synthesis) and ENK regulation in dams. On post partum day 10, pups were removed for a 4-h period from a group of the dams then returned for 4- and 24-h periods. It was examined whether such a brief interruption of suckling provokes full up-regulation of TH and down-regulation of ENK, and whether reinitiation of suckling limits the extent to which TH up- and ENK down-regulate. At the end of experiment, the animals were decapitated. In situ hybridization was used to examine the expression of TH and ENK mRNA in the arcuate nucleus where TIDA neurons reside. The results showed that, on one hand, the removal of pups induced TH up-regulation, on the other hand, ENK expression also increased 8 h after removal of pups and then started to slowly decline. In dams whose sucklings were reinitiated both TH and ENK mRNAs were up-regulated at least for a day. ENK expression responded more slowly to the removal of pups than expression of TH, and after reinitiation of suckling, the temporal program of regulation of both TH and ENK expressions ran parallel in the first 24 h.
Figures
Similar articles
-
The responsiveness of tuberoinfundibular dopaminergic neurons to prolactin feedback is diminished between early lactation and midlactation in the rat.Endocrinology. 1996 Jan;137(1):47-54. doi: 10.1210/endo.137.1.8536641. Endocrinology. 1996. PMID: 8536641
-
Suppressed tyrosine hydroxylase gene expression in the tuberoinfundibular dopaminergic system during lactation.Endocrinology. 1993 Oct;133(4):1657-63. doi: 10.1210/endo.133.4.8104777. Endocrinology. 1993. PMID: 8104777
-
Induction of enkephalin in tuberoinfundibular dopaminergic neurons of pregnant, pseudopregnant, lactating and aged female rats.Neuroendocrinology. 1994 Aug;60(2):185-93. doi: 10.1159/000126750. Neuroendocrinology. 1994. PMID: 7969776
-
Suckling stimulus suppresses messenger RNA for tyrosine hydroxylase in arcuate neurons during lactation.J Comp Neurol. 2001 Oct 1;438(4):423-32. doi: 10.1002/cne.1325. J Comp Neurol. 2001. PMID: 11559898
-
A bold view of the lactating brain: functional magnetic resonance imaging studies of suckling in awake dams.J Neuroendocrinol. 2011 Nov;23(11):1009-19. doi: 10.1111/j.1365-2826.2011.02184.x. J Neuroendocrinol. 2011. PMID: 21722215 Free PMC article. Review.
Cited by
-
60 YEARS OF NEUROENDOCRINOLOGY: The hypothalamo-prolactin axis.J Endocrinol. 2015 Aug;226(2):T101-22. doi: 10.1530/JOE-15-0213. Epub 2015 Jun 22. J Endocrinol. 2015. PMID: 26101377 Free PMC article. Review.
-
Anatomical Markers of Activity in Hypothalamic Neurons.Compr Physiol. 2020 Mar 12;10(2):549-575. doi: 10.1002/cphy.c170021. Compr Physiol. 2020. PMID: 32163202 Free PMC article. Review.
References
-
- Arbogast LA, Voogt JL. Endogenous opioid peptides contribute to suckling-induced prolactin release by suppressing tyrosine hydroxylase activity and messenger ribonucleic acid levels in tuberoinfundibular dopaminergic neurons. Endocrinology. 1998;139:2857–2862. - PubMed
-
- Ben-Jonathan N, Oliver C, Weiner HJ, Mical RS, Porter JC. Dopamine in hypophyseal portal plasma of the rat during estrous cycle and throughout pregnancy. Endocrinology. 1977;100:452–458. - PubMed
-
- Berghorn K, Bonnet J, Hoffman G. cFos immunoreactivity is enhanced with biotin amplification. J Histochem Cytochem. 1994;42:1635–1642. - PubMed
-
- Berghorn KA, Duska B, Wang H, Le WW, Sherman T, Hoffman GE. Cellular analysis of tyrosine hydroxylase expression during lactation. Soc Neurosci. 1995;21:1899.
-
- Berghorn KA, Le WW, Sherman TG, Hoffman GE. Suckling stimulus suppresses messenger RNA for tyrosine hydroxylase in arcuate neurons during lactation. J Comp Neurol. 2001;438:423–432. - PubMed
Publication types
MeSH terms
Substances
Grants and funding
LinkOut - more resources
Full Text Sources
Miscellaneous
