. 2010 Dec 2:10:746.
doi: 10.1186/1471-2458-10-746.

B-vitamin consumption and the prevalence of diabetes and obesity among the US adults: population based ecological study

Affiliations

B-vitamin consumption and the prevalence of diabetes and obesity among the US adults: population based ecological study

Shi-Sheng Zhou et al. BMC Public Health. .

Abstract

Background: The global increased prevalence of obesity and diabetes occurred after the worldwide spread of B-vitamins fortification, in which whether long-term exposure to high level of B vitamins plays a role is unknown. Our aim was to examine the relationships between B-vitamins consumption and the obesity and diabetes prevalence.

Methods: This population based ecological study was conducted to examine possible associations between the consumption of the B vitamins and macronutrients and the obesity and diabetes prevalence in the US population using the per capita consumption data from the US Economic Research Service and the prevalence data from the US Centers for Disease Control and Prevention.

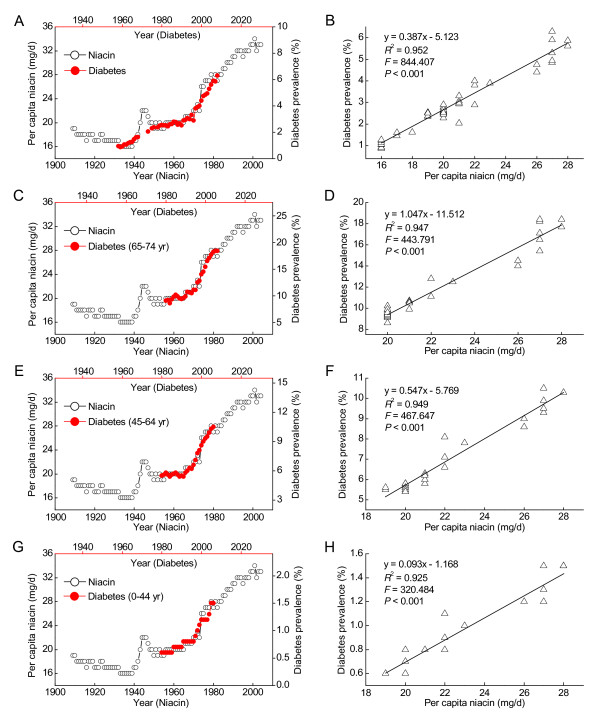
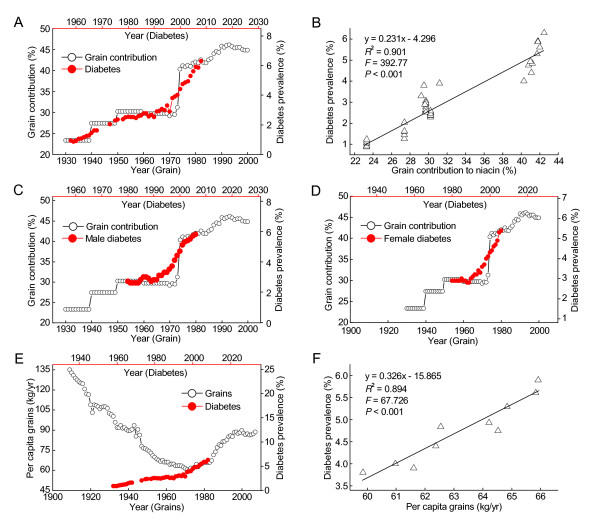
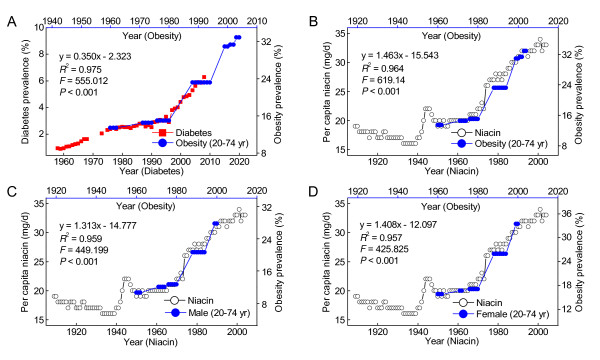
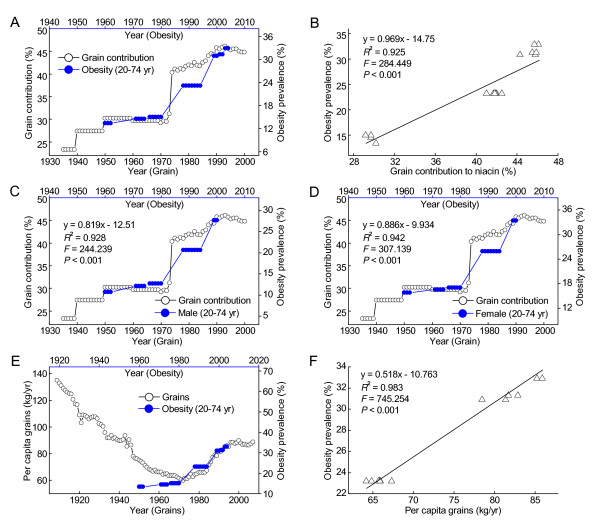
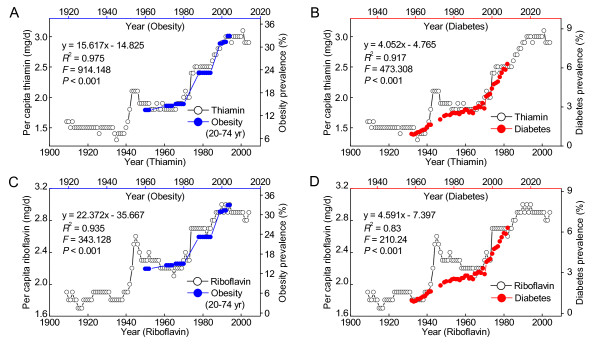
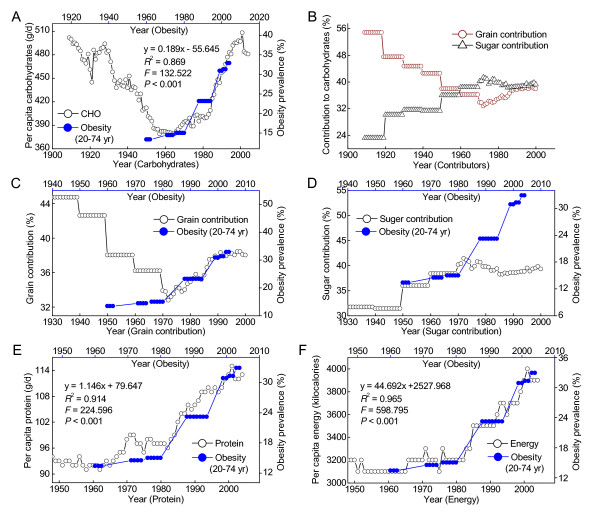
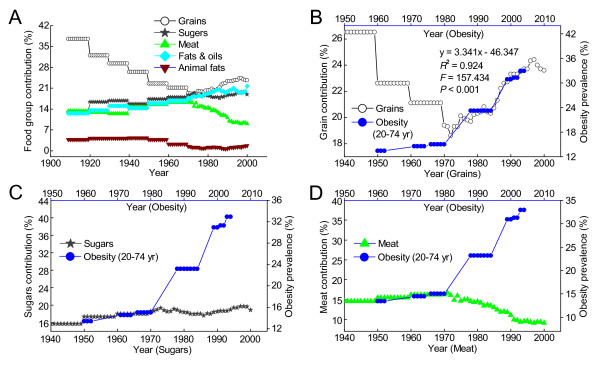
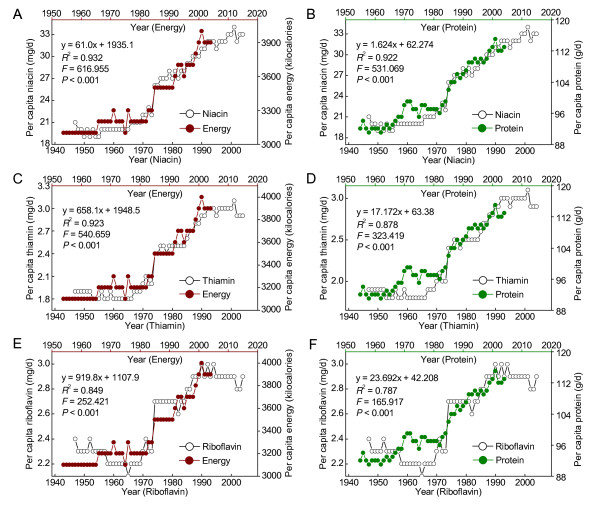
Results: The prevalences of diabetes and adult obesity were highly correlated with per capita consumption of niacin, thiamin and riboflavin with a 26-and 10-year lag, respectively (R2 = 0.952, 0.917 and 0.83 for diabetes, respectively, and R2 = 0.964, 0.975 and 0.935 for obesity, respectively). The diabetes prevalence increased with the obesity prevalence with a 16-year lag (R2 = 0.975). The relationships between the diabetes or obesity prevalence and per capita niacin consumption were similar both in different age groups and in male and female populations. The prevalence of adult obesity and diabetes was highly correlated with the grain contribution to niacin (R2 = 0.925 and 0.901, respectively), with a 10-and 26-year lag, respectively. The prevalence of obesity in US adults during 1971-2004 increased in parallel with the increase in carbohydrate consumption with a 10-year lag. The per capita energy and protein consumptions positively correlated with the obesity prevalence with a one-year lag. Moreover, there was an 11-year lag relationship between per capita energy and protein consumption and the consumption of niacin, thiamin and riboflavin (R2 = 0.932, 0.923 and 0.849 for energy, respectively, and R2 = 0.922, 0.878 and 0.787 for protein, respectively).

Conclusions: Long-term exposure to high level of the B vitamins may be involved in the increased prevalence of obesity and diabetes in the US in the past 50 years. The possible roles of B-vitamins fortification and excess niacin consumption in the increased prevalence of obesity and diabetes were discussed.


Figures

Figure 1
Figure 1
The correlations between the per capita niacin consumption and the diabetes prevalence in the US. A: The trends in the niacin consumption from 1909 to 2004 (Ref. [23]) and in the diabetes prevalence in the US in 1958-2008 (Ref. [25]). Note: the data on the prevalence of diabetes in 1969-1972, 1974 and 1977 are not available. B: The 26-year lag-regression plot using the data in A. C, E and G: The trends in the niacin consumption and in the diabetes prevalence in different age groups (Ref. [27]). D, F and H: The lag-regression plots using the data in C, E and G, respectively. The lag time is 24, 26 and 26 years for 65-74, 45-64, and 0-44 years age groups, respectively.
Figure 2
Figure 2
The correlations between the grain contribution/consumption and the diabetes prevalence in the US. A: The trends in the grain contribution to daily per capita niacin consumption (Ref. [14]) and in the diabetes prevalence (Ref. [25]). B: The 26-year lag-regression plot using the data in A. C and D: showing the similar relationships in both sexes. The diabetes data are from Ref. [26]. E: The trends in the per capita grain consumption (Ref. [24]) and the diabetes prevalence (Ref. [25]). F: The lag-regression plot of the diabetes prevalence in 1997-2008 against the grain consumption in 1971-1982 using the data in E.
Figure 3
Figure 3
The correlations between the niacin consumption and the obesity prevalence in US adults. A: Trends of prevalence of obesity and diabetes in the US. B: The trends in the per capita niacin consumption (Ref. [23]) and in the obesity prevalence (Ref. [30]). The 10-year lag regression result is presented in the panel. C and D: showing the similar associations in both sexes. The obesity prevalence data are derived from Ref. [31]. The lag regression results are presented in each panel.
Figure 4
Figure 4
The correlations between the grain contribution and consumption and the obesity prevalence in US adults. A: The trends in the grain contribution to niacin (Ref. [14]) and the obesity prevalence (Ref. [30]). B: The 10-year lag-regression plot using the data in A. C and D show the similar correlations in both sexes. E: The trends in the yearly grain consumption (Ref. [24]) and the obesity prevalence (Ref. [30]). The 10-year lag regression result is presented in each panel. F: The lag-regression plot of the obesity prevalence in 1988-2004 against the per capita grain consumption in 1978-1994 using the data in E.
Figure 5
Figure 5
Correlations between thiamin and riboflavin consumption and the prevalence of obesity and diabetes in the US. A and B: The trends in the per capita thiamin consumption and the prevalence of obesity and diabetes. C and D: The trends in the per capita riboflavin consumption and the prevalence of obesity and diabetes. The 26-year lag regression results are presented in each panel.
Figure 6
Figure 6
Relationships between carbohydrate, protein and energy consumption and the obesity prevalence in the US. A: The trends in the per capita carbohydrate consumption (Ref. [23]) and the obesity prevalence (Ref. [30]). Lag-regression result of the relationship between the per capita carbohydrate consumption in 1961-1994 and the obesity prevalence in 1971-2004 is given in the panel. CHO = carbohydrate. B: The trends in grain and sugar contribution to total carbohydrate (Ref. [14]). C and D: The relationships between grain and sugar contribution to daily per capita carbohydrate consumption and the obesity prevalence. E and F: respectively showing that the per capita protein and energy consumption increased in parallel with the obesity prevalence with a one-year lag. The one-year lag-regression result is presented in each panel.
Figure 7
Figure 7
The consumption of saturated fat, cholesterol and fiber and obesity and diabetes prevalence in the US. A, C and E, The relationships between the obesity prevalence (Ref. [30]) and the per capita consumption of saturated fat, cholesterol and fiber (Ref. [23]). B, D and F, The relationships between the diabetes prevalence (Ref. [25]) and the per capita consumption of saturated fat, cholesterol and fiber.
Figure 8
Figure 8
Per capita energy consumption contributed from major food groups and the prevalence of obesity in US adults. A: Contributions to energy consumption from grains, sugars, meat, fats/oils and animal fats (Ref. [14]). B-D: Relationships between the obesity prevalence and the contributions of grains, sugars and meat, respectively.
Figure 9
Figure 9
Relationships between per capita B-vitamin consumption and energy and protein consumption in the US. A-F: Correlations between the consumption niacin, thiamin and riboflavin and the consumption of energy and protein in the US. The data on per capita consumption of energy and the main nutrients were derived from the databases of the ERS of the US (Ref. [23]). The 11-year lag-regression results are presented in each panel.

References

    1. Obesity: Preventing and Managing the Global Epidemic. Report of a WHO Consultation. World Health Organ Tech Rep Ser. 2000;894(i-xii):1–253. - PubMed
    1. Zimmet P, Alberti KG, Shaw J. Global and societal implications of the diabetes epidemic. Nature. 2001;414:782–787. doi: 10.1038/414782a. - DOI - PubMed
    1. Aye T, Levitsky LL. Type 2 diabetes: an epidemic disease in childhood. Curr Opin Pediatr. 2003;15:411–415. - PubMed
    1. Rosenbloom AL, Joe JR, Young RS, Winter WE. Emerging epidemic of type 2 diabetes in youth. Diabetes Care. 1999;22:345–354. doi: 10.2337/diacare.22.2.345. - DOI - PubMed
    1. Andreassi MG. Metabolic syndrome, diabetes and atherosclerosis: Influence of gene-environment interaction. Mutat Res. 2009;667:35–43. - PubMed

Publication types

MeSH terms