. 2010 Dec 2:10:377.
doi: 10.1186/1471-2148-10-377.

Evolution of Rhizaria: new insights from phylogenomic analysis of uncultivated protists

Affiliations

Evolution of Rhizaria: new insights from phylogenomic analysis of uncultivated protists

Fabien Burki et al. BMC Evol Biol. .

Abstract

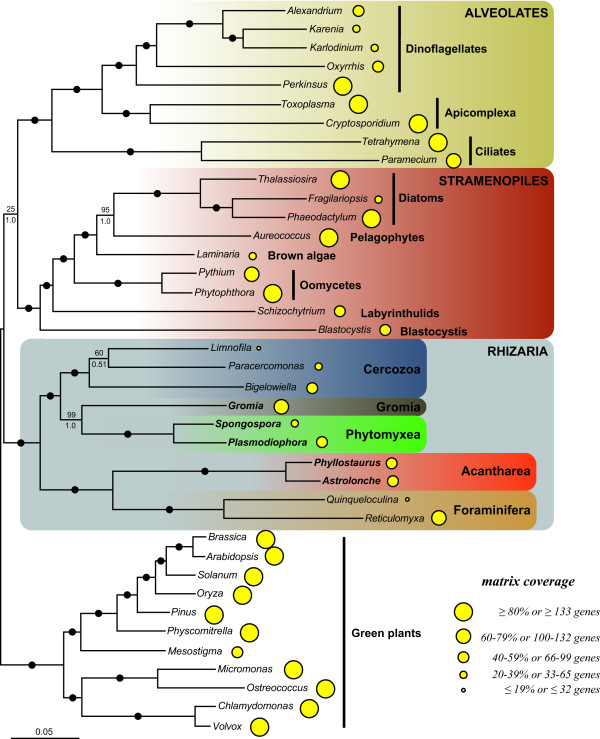
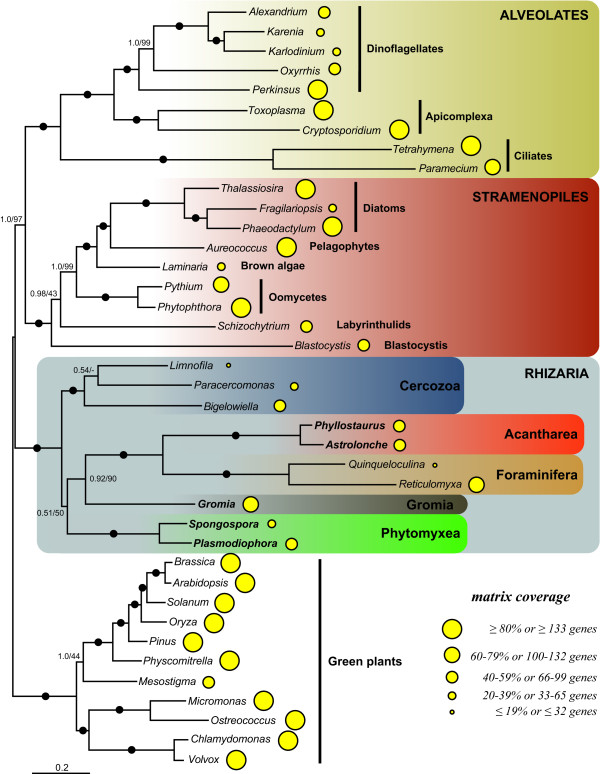
Background: Recent phylogenomic analyses have revolutionized our view of eukaryote evolution by revealing unexpected relationships between and within the eukaryotic supergroups. However, for several groups of uncultivable protists, only the ribosomal RNA genes and a handful of proteins are available, often leading to unresolved evolutionary relationships. A striking example concerns the supergroup Rhizaria, which comprises several groups of uncultivable free-living protists such as radiolarians, foraminiferans and gromiids, as well as the parasitic plasmodiophorids and haplosporids. Thus far, the relationships within this supergroup have been inferred almost exclusively from rRNA, actin, and polyubiquitin genes, and remain poorly resolved. To address this, we have generated large Expressed Sequence Tag (EST) datasets for 5 species of Rhizaria belonging to 3 important groups: Acantharea (Astrolonche sp., Phyllostaurus sp.), Phytomyxea (Spongospora subterranea, Plasmodiophora brassicae) and Gromiida (Gromia sphaerica).

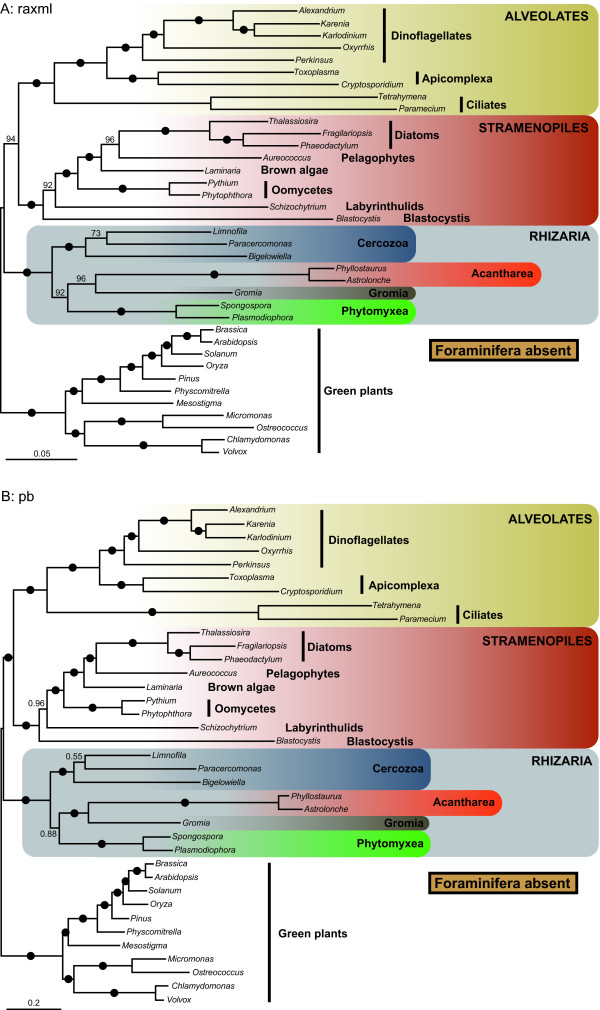
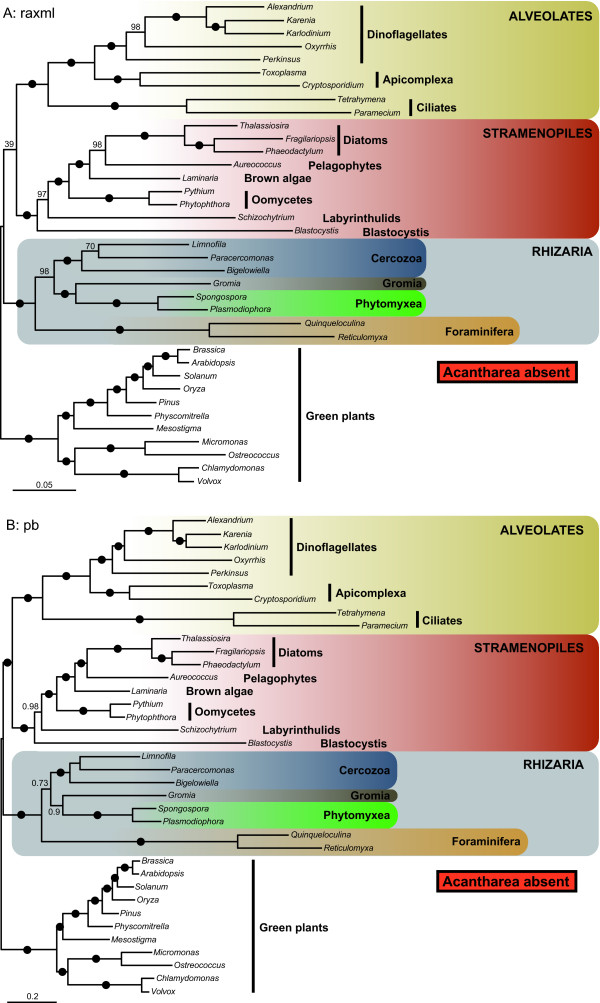
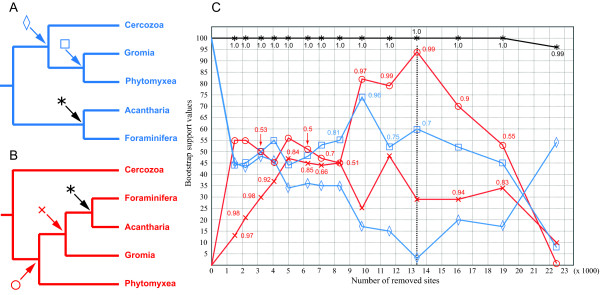
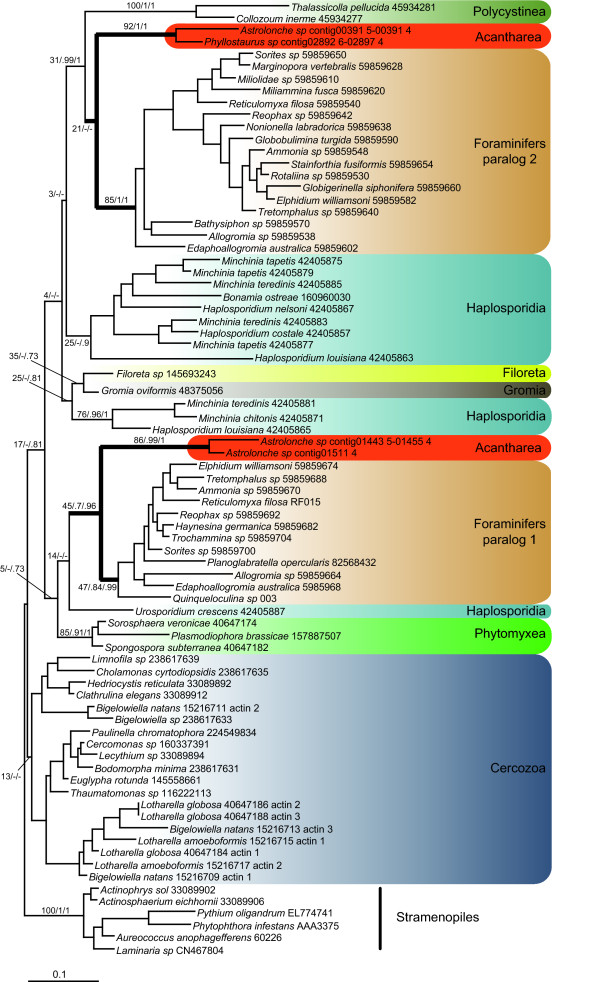
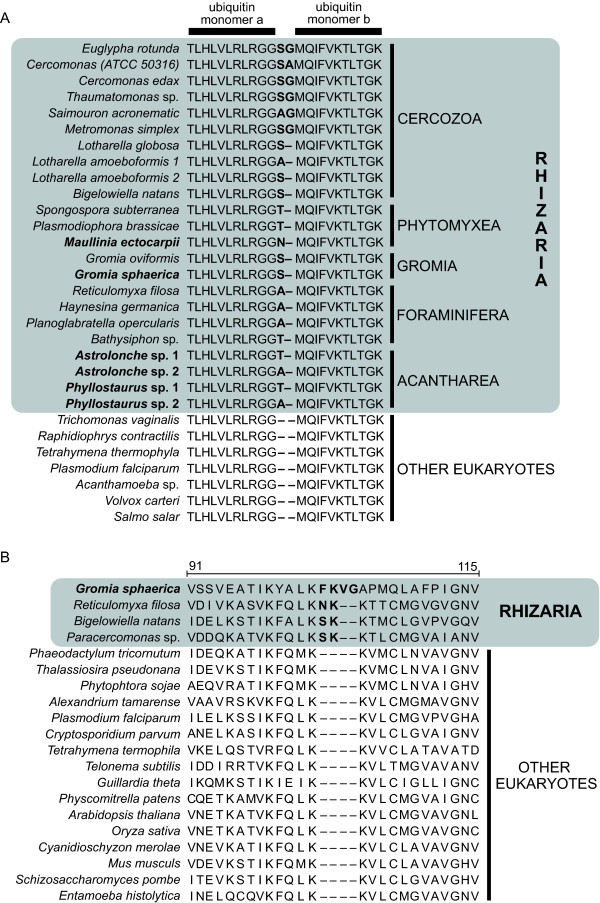
Results: 167 genes were selected for phylogenetic analyses based on the representation of at least one rhizarian species for each gene. Concatenation of these genes produced a supermatrix composed of 36,735 amino acid positions, including 10 rhizarians, 9 stramenopiles, and 9 alveolates. Phylogenomic analyses of this large dataset revealed a strongly supported clade grouping Foraminifera and Acantharea. The position of this clade within Rhizaria was sensitive to the method employed and the taxon sampling: Maximum Likelihood (ML) and Bayesian analyses using empirical model of evolution favoured an early divergence, whereas the CAT model and ML analyses with fast-evolving sites or the foraminiferan species Reticulomyxa filosa removed suggested a derived position, closely related to Gromia and Phytomyxea. In contrast to what has been previously reported, our analyses also uncovered the presence of the rhizarian-specific polyubiquitin insertion in Acantharea. Finally, this work reveals another possible rhizarian signature in the 60S ribosomal protein L10a.

Conclusions: Our study provides new insights into the evolution of Rhizaria based on phylogenomic analyses of ESTs from three groups of previously under-sampled protists. It was enabled through the application of a recently developed method of transcriptome analysis, requiring very small amount of starting material. Our study illustrates the potential of this method to elucidate the early evolution of eukaryotes by providing large amount of data for uncultivable free-living and parasitic protists.


Figures

Figure 1
Figure 1
Phylogeny of SAR as inferred by RAxML and the LG model of evolution. The tree was rooted using the green plants. Species with new genomic data generated in this study are in bold. An identical topology was also recovered using MrBayes and the WAG model of evolution. Black dots correspond to 100% ML bootstrap support (BP) and 1.0 Bayesian posterior probabilities (PP). Numbers at nodes represent BP (above) and PP (below) when not maximal. The area of the yellow circles are proportional to the number of genes included in the supermatrix for each taxon. The scale bar represents the estimated number of amino acid substitutions per site.
Figure 2
Figure 2
Phylogeny of SAR as inferred by PhyloBayes and the CAT model of evolution. Consensus tree between 2 independent Markov chains, rooted with green plants. Species with new genomic data generated in this study are in bold. Black dots correspond to 1.0 PP and 100% BP and values at nodes PP and BP when not maximal. The area of the yellow circles are proportional to the number of genes included in the supermatrix for each taxon. The scale bar represents the estimated number of amino acid substitutions per site.
Figure 3
Figure 3
Phylogeny of SAR without Reticulomyxa. RAxML with "LG" model (A) and PhyloBayes with "CAT" model (B) phylogenies of the SAR group, rooted with the green plants. The foraminiferan species Reticulomyxa filosa was removed from the alignment for inferring these trees. Black dots correspond to 100% ML bootstrap support (BP) in (A) and 1.0 Bayesian posterior probabilities (PP) in (B). Numbers at nodes represent BP (A) or PP (B) when not maximal. The scale bar represents the estimated number of amino acid substitutions per site.
Figure 4
Figure 4
Phylogeny of SAR without Foraminifera. RAxML with "LG" model (A) and PhyloBayes with "CAT" model (B) phylogenies of the SAR group, rooted with the green plants. Both foraminiferan taxa Reticulomyxa filosa and Quinqueloculina sp. were removed from the alignment for inferring these trees. Black dots correspond to 100% ML bootstrap support (BP) in (A) and 1.0 Bayesian posterior probabilities (PP) in (B). Numbers at nodes represent BP (A) or PP (B) when not maximal. The scale bar represents the estimated number of amino acid substitutions per site.
Figure 5
Figure 5
Phylogeny of SAR without Acantharea. RAxML with "LG" model (A) and PhyloBayes with "CAT" model (B) phylogenies of the SAR group, rooted with the green plants. Both acantharean taxa Astrolonche sp. and Phyllostaurus sp. were removed from the alignment for inferring these trees. Black dots correspond to 100% ML bootstrap support (BP) in (A) and 1.0 Bayesian posterior probabilities (PP) in (B). Numbers at nodes represent BP (A) or PP (B) when not maximal. The scale bar represents the estimated number of amino acid substitutions per site.
Figure 6
Figure 6
Site removal analysis. Figures (A) and (B) illustrate the bipartitions that were sought in the pool of trees generated by bootstrapped ML reconstructions, corresponding to the "LG" (blue) and "CAT" (red) relationships, respectively. The monitored relationships are indicated as followed: star: Foraminifera-Acantharea grouping; square: Gromia sister to Phytomyxea; diamond: basal position of the Foraminifera-Acantharea clade within Rhizaria; cross: Gromia sister to the Foraminifera-Acantharea clade; circle: basal position of Cercozoa to the rest of rhizarian lineages. (C) Dependence of the bootstrap support values (BP) for the monitored relationships on the number of removed fast-evolving sites, marked for each of the 14 shorter alignments. The blue and red lines correspond to the BP of nodes found in the "LG" and "CAT" trees, respectively. The black line corresponds to the BP for the Foraminifera-Acantharea grouping. The vertical dashed line shows the step (13'379 positions removed) where the supports for the sister position of Retaria reached a minimum and the support for the sister position of Cercozoa a maximum. Numbers next to the marks are PP obtained with the "CAT" model (PhyloBayes), resulting from the pooling of all trees after burnin of 2 independent chains and corresponding to the bifurcations found. At removal steps 1, 2, 4 and 5 only one PP value is shown next to the cross mark, indicating that the CAT model could not infer the position of Phytomyxea within Rhizaria (multifurcation). The y-axis represents the BP and the x-axis the length of the alignments after the removal of sites.
Figure 7
Figure 7
Actin phylogeny of Rhizaria. ML phylogeny of Rhizaria based on actin, rooted with stramenopiles as outgroup. Numbers at nodes represent the bootstrap values obtained with RAxML ("LG" model) and the posterior probabilities obtained with PhyloBayes ("LG" model) and MrBayes ("WAG" model). For clarity, only the values for the deep nodes and the nodes of interest for this study are shown The scale bar represents the estimated number of amino acid substitutions per site. The branches leading to Acantharea and Foraminifera in actin paralogs 1 and 2 are in bold.
Figure 8
Figure 8
Specific insertions in Rhizaria. Rhizarian specific insertions of (A) 1-2 residues between monomers in polyubiquitin and (B) 2 residues at position 103 in the 60S ribosomal protein L10a. Numbers above the alignment shows the sequence position in the Mus protein. Species names in bold indicate new sequences generated in this study.

References

    1. Keeling PJ, Burger G, Durnford DG, Lang BF, Lee RW, Pearlman RE, Roger AJ, Gray MW. The tree of eukaryotes. Trends Ecol Evol. 2005;20:670–676. doi: 10.1016/j.tree.2005.09.005. - DOI - PubMed
    1. Cavalier-Smith T. Kingdoms Protozoa and Chromista and the eozoan root of the eukaryotic tree. Biol Lett. 2009. in press . - PMC - PubMed
    1. Burki F, Shalchian-Tabrizi K, Minge MA, Skjaeveland A, Nikolaev SI, Jakobsen KS, Pawlowski J. Phylogenomics reshuffles the eukaryotic supergroups. PLoS ONE. 2007;2:e790. doi: 10.1371/journal.pone.0000790. - DOI - PMC - PubMed
    1. Burki F, Shalchian-Tabrizi K, Pawlowski J. Phylogenomics reveals a new 'megagroup' including most photosynthetic eukaryotes. Biol Lett. 2008;4:366–369. doi: 10.1098/rsbl.2008.0224. - DOI - PMC - PubMed
    1. Hackett JD, Yoon HS, Li S, Reyes-Prieto A, Rümmele SE, Bhattacharya D. Phylogenomic analysis supports the monophyly of cryptophytes and haptophytes and the association of rhizaria with chromalveolates. Mol Biol Evol. 2007;24:1702–1713. doi: 10.1093/molbev/msm089. - DOI - PubMed

Publication types

Associated data