Comparative Study
. 2010 Dec 2:11:688.
doi: 10.1186/1471-2164-11-688.

Comparative genomics of the bacterial genus Listeria: Genome evolution is characterized by limited gene acquisition and limited gene loss

Affiliations
Comparative Study

Comparative genomics of the bacterial genus Listeria: Genome evolution is characterized by limited gene acquisition and limited gene loss

Henk C den Bakker et al. BMC Genomics. .

Abstract

Background: The bacterial genus Listeria contains pathogenic and non-pathogenic species, including the pathogens L. monocytogenes and L. ivanovii, both of which carry homologous virulence gene clusters such as the prfA cluster and clusters of internalin genes. Initial evidence for multiple deletions of the prfA cluster during the evolution of Listeria indicates that this genus provides an interesting model for studying the evolution of virulence and also presents practical challenges with regard to definition of pathogenic strains.

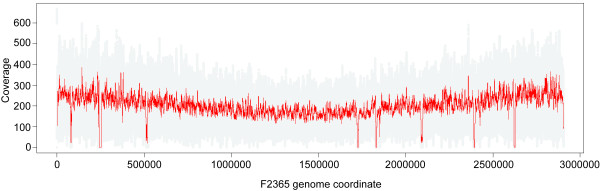
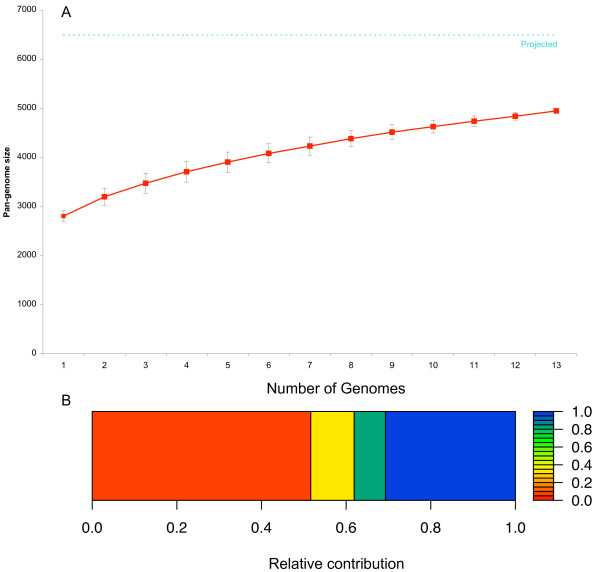
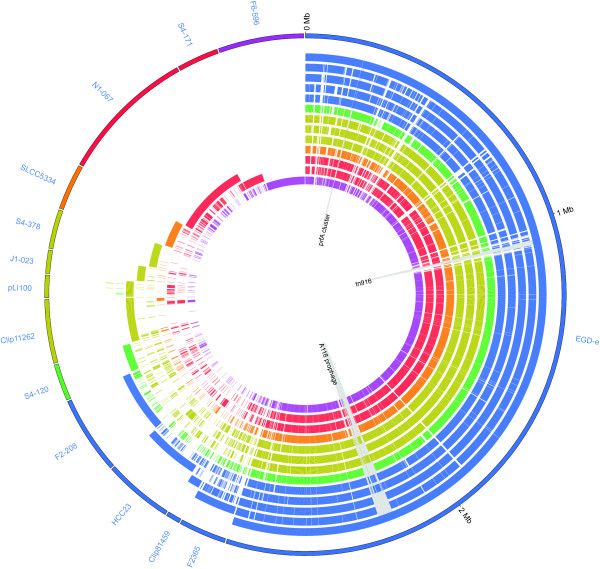
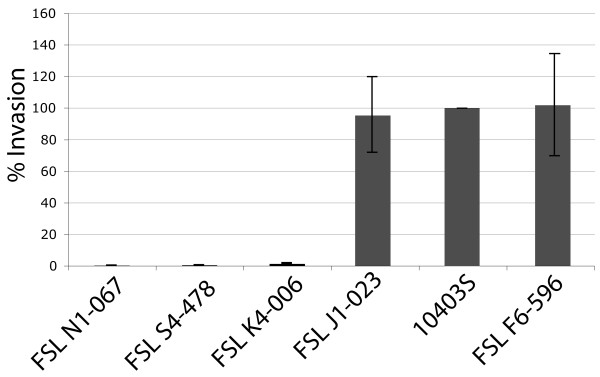
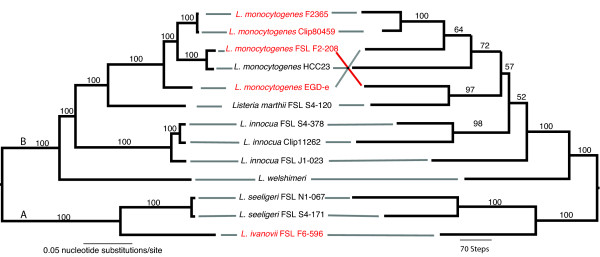
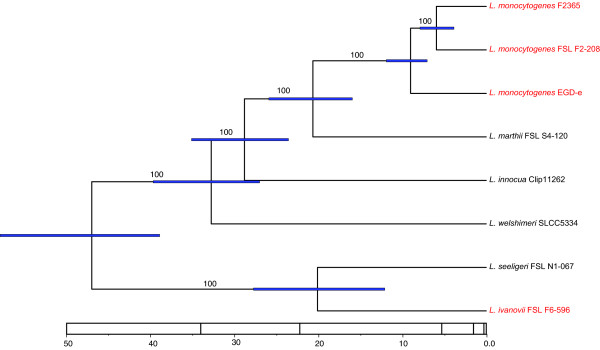
Results: To better understand genome evolution and evolution of virulence characteristics in Listeria, we used a next generation sequencing approach to generate draft genomes for seven strains representing Listeria species or clades for which genome sequences were not available. Comparative analyses of these draft genomes and six publicly available genomes, which together represent the main Listeria species, showed evidence for (i) a pangenome with 2,032 core and 2,918 accessory genes identified to date, (ii) a critical role of gene loss events in transition of Listeria species from facultative pathogen to saprotroph, even though a consistent pattern of gene loss seemed to be absent, and a number of isolates representing non-pathogenic species still carried some virulence associated genes, and (iii) divergence of modern pathogenic and non-pathogenic Listeria species and strains, most likely circa 47 million years ago, from a pathogenic common ancestor that contained key virulence genes.

Conclusions: Genome evolution in Listeria involved limited gene loss and acquisition as supported by (i) a relatively high coverage of the predicted pan-genome by the observed pan-genome, (ii) conserved genome size (between 2.8 and 3.2 Mb), and (iii) a highly syntenic genome. Limited gene loss in Listeria did include loss of virulence associated genes, likely associated with multiple transitions to a saprotrophic lifestyle. The genus Listeria thus provides an example of a group of bacteria that appears to evolve through a loss of virulence rather than acquisition of virulence characteristics. While Listeria includes a number of species-like clades, many of these putative species include clades or strains with atypical virulence associated characteristics. This information will allow for the development of genetic and genomic criteria for pathogenic strains, including development of assays that specifically detect pathogenic Listeria strains.


Figures

Figure 1
Figure 1
Coverage of F2365 genome by R2-574 SOLiD™ system reads. Depth of coverage of uniquely placed reads was plotted along the length of the L. monocytogenes F2365 chromosome. Gray dots indicate coverage at each base and the red line indicates the moving average with a window size of 1000. Uncovered gaps represent non-unique sequences, including the six rRNA operons.
Figure 2
Figure 2
Cumulative size and composition of the Listeria pan-genome. (a) Cumulative pan-genome size plots were calculated by selecting strains without replacement in random order 500 times, and then calculating the mean pan-genome size at each sampling point (solid red line). Error bars indicate one standard deviation from the mean. Estimated pan-genome size from mixture model analysis is indicated as a dotted cyan line. (b) The graphical display of the mixture model represents the four components of the pan-genome as rectangles, including (i) a component of 31% of the genes with a detection probability of 1.0 (blue: the core-genome), (ii) a component representing 7% of the genes with a detection probability of 0.82 (teal), (iii) a component of 10% of the genes with a detection probability of 0.33 (yellow), and (iv) a component of 52% of the genes with a detection probability of 0.06 (rare genes: orange).
Figure 3
Figure 3
Comparative genome content of 13 Listeria chromosomes and L. innocua plasmid pLI100. The outermost circle indicates the source of each gene in the pan-genome with each gene represented by a constant width wedge. Starting at the top of the figure (0 Mb) and moving clockwise, all EGD-e genes are arranged in chromosomal order. Continuing clockwise, all genes not present in EGD-e are grouped by strain (as indicated by segment labels). Genes in the F2365 segment are present in F2365, but absent from EGD-e, and genes in the Clip81459 segment are present in Clip81459, but absent from F2365 and EGD-e, and so on. In this way, each gene is represented only once in the diagram. Gene order in all segments except EGD-e is monotonically increasing, but discontinuous, since shared genes may be represented in other segments. Internal circles indicate gene presence (solid color) or absence (unfilled) of each gene in each of the 13 strains examined. Circles from outer to inner are in the same order as strains on the outer circle, starting with EGD-e, followed by F2365, etc. L. monocytogenes strains are in blue; L. marthii is in green; L. innocua strains are in gold; L. welshimeri is in orange; L. seeligeri strains are in red; L. ivanovii subsp. londoniensis is in purple. The location, in the EGD-e genome, of the prfA virulence cluster, conjugative transposon tn916 and prophage A118 are specifically indicated. This figure was created using the Circos software [85].
Figure 4
Figure 4
Invasion efficiencies in Caco-2 cells of Listeria strains. The strains tested are shown on the x-axis and include L. seeligeri FSL N1-067, L. innocua FSL S4-378 (non-hemolytic), L. monocytogenes 10403S ΔinlA (FSL K4-006), L. innocua FSL J1-023 (hemolytic) and L. ivanovii subsp. londoniensis FSL F6-596 (ATCC 49954). Invasion efficiency (the number of recovered cells/number of cells used for inoculation) was normalized to the invasion efficiency obtained for L. monocytogenes 10403S, which was set as 100%, and was included as a control strain in each essay. Three independent invasion assays were performed for each strain tested.
Figure 5
Figure 5
Comparison of phylogenetic trees based on Listeria core gene sequences and genomic gene content. The 100 gene sequence tree (left) was inferred using Bayesian phylogenetic inference (MrBayes v. 3.12) and the values above the branches are the posterior probabilities. The gene content tree based on the presence/absence of 4950 orthologous genes (right) was inferred using maximum parsimony and the values above the branches are bootstrap values based on 1000 bootstrap replicates. Pathogenic strains are colored red, while non-pathogenic strains are black.
Figure 6
Figure 6
Maximum clade credibility tree summarizing the results of the Bayesian molecular clock analysis of the 100 concatenated core genome genes. The timeline indicates the age of the nodes when a mutation rate of 4.5 × 10⁻⁹ per year/site was used to calibrate the tree. One strain from each species or lineage was included in the analysis; L. monocytogenes lineages I (F2365), II (EGD-e) and IIIC (FSL F2-208), L. marthii (FSL S4-120), L. innocua (CLIP11262), L. welshimeri (SLCC5334), L. seeligeri (FSL N1-067), and L. ivanovii subsp. londoniensis (FSL F6-596). Values above the branches indicate posterior probability values, blue horizontal bars on the nodes show the 95% highest probability density of the inferred age of the nodes. The posterior probability of the individual trees and 95% highest probability density of the divergence time were based on 9,000,000 post burn-in generations of a 10,000,000 generation run. The values on the time lines represent ages as million years before present. Labels of pathogenic strains have been colored red.

References

    1. Graves LM, Helsel LO, Steigerwalt AG, Morey RE, Daneshvar MI, Roof SE, Orsi RH, Fortes ED, Millilo SR, den Bakker HC, Wiedmann M, Swaminathan B, Sauders BD. Listeria marthii sp. nov., isolated from the natural environment, Finger Lakes National Forest. Int J Syst Evol Microbiol. 2010;60:1280–1288. doi: 10.1099/ijs.0.014118-0. - DOI - PubMed
    1. Leclercq A, Clermont D, Bizet C, Grimont P, Le Flèche-Matéos A, Roche S, Buchrieser C, Cadet-Daniel V, Le Monnier A, Lecuit M, Allerberger F. Listeria rocourtiae sp. nov. Int J Syst Evol Microbiol. 2009;60:2210–2214. doi: 10.1099/ijs.0.017376-0. - DOI - PubMed
    1. Schmid M, Ng E, Lampidis R, Emmerth M, Walcher M, Kreft J, Goebel W, Wagner M, Schleifer K. Evolutionary history of the genus Listeria and its virulence genes. Syst Appl Microbiol. 2005;28:1–18. doi: 10.1016/j.syapm.2004.09.005. - DOI - PubMed
    1. Stuart S, Welshimer H. Taxonomic reexamination of Listeria Pirie and transfer of Listeria grayi and Listeria murrayi to a new genus, Murraya. Int J Syst Evol Microbiol. 1974;24:177–185.
    1. Cummins AJ, Fielding AK, McLauchlin J. Listeria ivanovii infection in a patient with AIDS. J Infect. 1994;28:89–91. doi: 10.1016/S0163-4453(94)94347-8. - DOI - PubMed

Publication types

MeSH terms

Substances

LinkOut - more resources