Comparative Study
. 2010 Dec 14;122(24):2529-37.
doi: 10.1161/CIRCULATIONAHA.109.930446. Epub 2010 Nov 29.

Inhibition and genetic ablation of the B7/CD28 T-cell costimulation axis prevents experimental hypertension

Affiliations
Comparative Study

Inhibition and genetic ablation of the B7/CD28 T-cell costimulation axis prevents experimental hypertension

Antony Vinh et al. Circulation. .

Abstract

Background: The pathogenesis of hypertension remains poorly understood, and treatment is often unsuccessful. Recent evidence suggests that the adaptive immune response plays an important role in this disease. Various hypertensive stimuli cause T-cell activation and infiltration into target organs such as the vessel and the kidney, which promotes vascular dysfunction and blood pressure elevation. Classically, T-cell activation requires T-cell receptor ligation and costimulation. The latter often involves interaction between B7 ligands (CD80 and CD86) on antigen-presenting cells with the T-cell coreceptor CD28. This study was therefore performed to examine the role of this pathway in hypertension.

Methods and results: Angiotensin II-induced hypertension increased the presence of activated (CD86(+)) dendritic cells in secondary lymphatic tissues. Blockade of B7-dependent costimulation with CTLA4-Ig reduced both angiotensin II- and deoxycorticosterone acetate (DOCA)-salt-induced hypertension. Activation of circulating T cells, T-cell cytokine production, and vascular T-cell accumulation caused by these hypertensive stimuli were abrogated by CTLA4-Ig. Furthermore, in mice lacking B7 ligands, angiotensin II caused minimal blood pressure elevation and vascular inflammation, and these effects were restored by transplantation with wild-type bone marrow.

Conclusions: T-cell costimulation via B7 ligands is essential for development of experimental hypertension, and inhibition of this process could have therapeutic benefit in the treatment of this disease.


Figures

Figure 1
Figure 1
Inhibition of CD80/CD86 costimulation by CTLA4-Ig in angiotensin II (Ang II)-dependent hypertension. C57Bl/6J mice received either angiotensin II (490 ng/min/kg) or buffer (sham) for 14 days via osmotic minipump. Animals were also co-treated with either CTLA4-Ig (250 µg) or control i.p. injections 3 days prior to the onset of angiotensin II and every 3 days thereafter. (A) Non-invasive blood pressure measurements obtained via the tail cuff method at days 0 (pre) and 14 (post) were compared using two-way ANOVA (n = 5 in each group). (B) Example traces of telemetric systolic blood pressure recordings obtained in freely moving control C57Bl/6J and CTLA4-Ig administered mice 3 days prior to angiotensin II pump implantation (baseline) and during the last 3 days of angiotensin II infusion. (C) Average blood pressure values obtained by telemetry at baseline and during angiotensin II infusion (n=6 for vehicle; n=8 for CTLA4-Ig). Comparisons were made using repeated measures ANOVA with Scheffe’s post-hoc test. (D) Aortic superoxide levels measured by monitoring the oxidation of dihydroethidium to 2-hydroxyethidium using high pressure liquid chromatography following 14 days of either buffer or angiotensin II infusion (n=5 for sham; n=5 for Ang II+vehicle n=6 for Ang II+CTLA4-Ig).
Figure 2
Figure 2
CTLA4-Ig inhibits T cell activation in angiotensin II dependent hypertension. Representative histograms (A) and mean data (B) are shown comparing the effects of vehicle vs. CTLA4-Ig treatment on CD4 + T cell surface expression of the early activation antigen CD69 during angiotensin II-induced hypertension. (C and D) Effect of CTLA4-Ig on the percentage of circulating CD4+/CD44high and CD4+/CCR5+ cells in angiotensin II-induced hypertension (n=6 for sham+vehicle; n=9 for Ang II+vehicle; n=6 for sham+CTLA4-Ig; n=10 for Ang II+CTLA4-Ig). Comparisons were made using two-way ANOVA and statistical values reflect the Bonferonni correction.
Figure 3
Figure 3
CTLA4-Ig inhibits vascular leukocyte and T cell infiltration in angiotensin II dependent hypertension. (A) Absolute numbers of total leukocytes (CD45+ cells) in the aorta of sham- and angiotensin II-infused mice treated with vehicle or CTLA4-Ig (n=6 for sham+vehicle; n=6 for Ang II+vehicle; n=6 for sham+CTLA4-Ig; n=8 for Ang II+CTLA4-Ig). (B) Flow cytometry showing T cells (CD45+CD3+) in aortic samples from sham- and angiotensin II-infused mice treated with vehicle or CTLA4-Ig. (C) Mean values for total aortic T cells (CD3+ cells) in all treatment groups (n=6 for sham+vehicle; n=6 for Ang II+vehicle; n=6 for sham+CTLA4-Ig; n=8 for Ang II+CTLA4-Ig). Panels D and E show production of inflammatory cytokines TNF-α and IFN-γ by T cells isolated from (D) spleen and (E) lymph nodes. Cells were stimulated for 48 hours on an anti-CD3 plate (n=5 for sham+vehicle; n=5 for Ang II+vehicle; n=5 for sham+CTLA4-Ig; n=6 for Ang II+CTLA4-Ig). Comparisons were made using two-way ANOVA and statistical values reflect the Bonferonni correction.
Figure 4
Figure 4
Angiotensin II increases CD86 expression on CD11c+ cells in secondary lymphoid organs. (A) Examples of staining of lymph node derived CD11c+ cells. Fluorescence minus one (FMO) controls were used to unequivocally identify CD45+, CD11c+, CD80+, CD86+ and MHC II+ DCs. CD11c+ positive cells were gated within CD45+ gate. Subsequently CD80+, CD86+ and MHC II+ cells were identified. (B) Bar graph showing frequencies of CD11c+CD86+ cells from blood aorta, spleen and lymph nodes (n=10; 10; 4; 16 for both sham and Ang II respectively). (C) Percentages of CD11c+CD80+ and CD11c+MHC II+ cells in lymph nodes from vehicle and angiotensin II-treated WT mice (n=6 for both groups).
Figure 5
Figure 5
Role of CD80/CD86 costimulation on development of angiotensin II-dependent hypertension. Angiotensin II (490ng/min/kg) was infused for 14 days in either wild-type C57Bl/6J (WT) or B7−/− mice. (A) Repeated measures ANOVA with Scheffe’s post hoc test was used to compare non-invasive blood pressure measurements obtained via tail cuff (n=7 for WT-sham; n=6 for WT-Ang II; n=11 for B7−/−-sham; n=12 for B7−/−-Ang II). (B) Average percentage of circulating CD4+/CD69+ and CD4+/CD44high cells as determined by flow cytometry in blood from vehicle- or angiotensin II-treated WT or B7−/− mice (n=7 for WT-sham; n=6 for WT-Ang II; n=11 for B7−/−-sham; n=11 for B7−/−-Ang II) (C) Representative contour plots acquired using flow cytometry and (D) average aortic CD45+CD3+ cells in sham and angiotensin II-treated wild-type or B7−/− mice (n=7 for WT-sham; n=6 for WT-Ang II; n=9 for B7−/−-sham; n=9 for B7−/−-Ang II). Comparisons of flow cytometry data were made using two-way ANOVA and statistical values reflect the Bonferonni correction for multiple comparisons.
Figure 6
Figure 6
Engrafting WT bone marrow into irradiated B7−/− mice restores angiotensin II-induced hypertension and vascular infiltration. (A) Repeated measures ANOVA with Scheffe’s post hoc test was used to compare non-invasive blood pressure measurements obtained via tail cuff (n=4 for sham; n=6 for Ang II; n=4 for sham+BMT; n=6 for Ang II+BMT). (B) Histograms showing CD80 and CD86 expression on DCs derived from WT and B7−/− mice and B7−/− mice engrafted with WT bone marrow. (C) Representative flow cytometry gated for aortic CD45+ and CD3+ cells from vehicle and angiotensin II-treated B7−/− mice engrafted with WT bone marrow. (D) Numbers of CD45+ and CD3+ cells in aortas of sham and angiotensin II-treated B7−/− mice engrafted with WT bone marrow (n=6 for sham; n=6 for Ang II). Statistical values shown in (D) were obtained using two-tailed t-test.
Figure 7
Figure 7
CTLA4-Ig attenuates DOCA-salt hypertension and its related vascular inflammation. DOCA-salt hypertension was induced in C57Bl/6J mice by uninephrectomy, subcutaneous implantation of a pellet containing deoxycorticosterone acetate (DOCA) and addition of 0.9% NaCl to the drinking water. Vehicle or CTLA4-Ig (250µg) was administered i.p. 3 days prior to 27 uninephrectomy and every 3 days thereafter. (A) Repeated measures ANOVA with Scheffe’s post hoc test was used to compare non-invasive blood pressure measurements obtained via the tail cuff method (n=10 for sham+vehicle; n=10 for sham+CTLA4-Ig; n=12 for DOCA+vehicle; n=13 for DOCA+CTLA4-Ig). (B) Average percentage of circulating CD4+ lymphocytes expressing CD69+ and CD44high as determined by flow cytometry (n=10 for sham+vehicle; n=8 for sham+CTLA4-Ig; n=11 for DOCA+vehicle; n=9 for DOCA+CTLA4-Ig). (C) Absolute numbers of total leukocytes (CD45+ cells) in aortas of sham- and DOCA-salt mice treated with vehicle or CTLA4-Ig (n=10 for sham+vehicle; n=10 for sham+CTLA4-Ig; n=11 for DOCA+vehicle; n=11 for DOCA+CTLA4-Ig). (D) Representative flow cytometric and (E) average aortic T cells accumulation (CD3+/CD45+) in control mice and mice with DOCA-salt hypertension treated with either vehicle or CTLA4-Ig (n=10 for sham+vehicle group; n=10 for sham+CTLA4-Ig; n=11 for DOCA+vehicle; n=11 for DOCA+CTLA4-Ig). Comparisons of flow cytometry data were made using two-way ANOVA and statistical values reflect the Bonferonni correction for multiple comparisons.
Figure 8
Figure 8
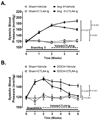
Treatment with CTLA4-Ig reverses angiotensin II and DOCA-salt induced hypertension. (A) Two weeks post-sham or angiotensin II treatment (4 week pump), mice were randomly assigned to receive either vehicle or CTLA4-Ig for the remaining 2 weeks of angiotensin II infusion (n=5 for all groups). (B) Similarly, after two weeks of sham/DOCA-salt challenge mice were randomly assigned to receive either vehicle or CTLA4-Ig for 4 weeks (n=5 for all groups). Non-invasive blood pressure measurements were obtained weekly obtained via tail cuff. Repeated measures ANOVA with Scheffe’s post hoc test was used to compare blood pressure responses during the vehicle/CTLA4-Ig treatment phase only.

Comment in

References

    1. Marvar PJ, Gordon FJ, Harrison DG. Blood pressure control: salt gets under your skin. Nat Med. 2009;15:487–488. - PubMed
    1. Rodriguez-Iturbe B, Vaziri ND, Johnson RJ. Inflammation, angiotensin II, and hypertension. Hypertension. 2008;52:e135. - PMC - PubMed
    1. Rodriguez-Iturbe B, Quiroz Y, Nava M, Bonet L, Chavez M, Herrera-Acosta J, Johnson RJ, Pons HA. Reduction of renal immune cell infiltration results in blood pressure control in genetically hypertensive rats. Am J Physiol Renal Physiol. 2002;282:F191–F201. - PubMed
    1. Guzik TJ, Hoch NE, Brown KA, McCann LA, Rahman A, Dikalov S, Goronzy J, Weyand C, Harrison DG. Role of the T cell in the genesis of angiotensin II induced hypertension and vascular dysfunction. J Exp Med. 2007;204:2449–2460. - PMC - PubMed
    1. Abbas A, Lichtman A. Cellular and molecular immunology. Philadelphia, PA: Elsevier Saunders; 2005.

Publication types

MeSH terms