. 2011 Feb 4;286(5):3935-43.
doi: 10.1074/jbc.M110.187492. Epub 2010 Dec 2.

Hetero-oligomerization of neuronal glutamate transporters

Affiliations

Hetero-oligomerization of neuronal glutamate transporters

Doreen Nothmann et al. J Biol Chem. .

Abstract

Excitatory amino acid transporters (EAATs) mediate the uptake of glutamate into neuronal and glial cells of the mammalian central nervous system. Two transporters expressed primarily in glia, EAAT1 and EAAT2, are crucial for glutamate homeostasis in the adult mammalian brain. Three neuronal transporters (EAAT3, EAAT4, and EAAT5) appear to have additional functions in regulating and processing cellular excitability. EAATs are assembled as trimers, and the existence of multiple isoforms raises the question of whether certain isoforms can form hetero-oligomers. Co-expression and pulldown experiments of various glutamate transporters showed that EAAT3 and EAAT4, but neither EAAT1 and EAAT2, nor EAAT2 and EAAT3 are capable of co-assembling into heterotrimers. To study the functional consequences of hetero-oligomerization, we co-expressed EAAT3 and the serine-dependent mutant R501C EAAT4 in HEK293 cells and Xenopus laevis oocytes and studied glutamate/serine transport and anion conduction using electrophysiological methods. Individual subunits transport glutamate independently of each other. Apparent substrate affinities are not affected by hetero-oligomerization. However, polarized localization in Madin-Darby canine kidney cells was different for homo- and hetero-oligomers. EAAT3 inserts exclusively into apical membranes of Madin-Darby canine kidney cells when expressed alone. Co-expression with EAAT4 results in additional appearance of basolateral EAAT3. Our results demonstrate the existence of heterotrimeric glutamate transporters and provide novel information about the physiological impact of EAAT oligomerization.


Figures
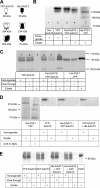
FIGURE 1.
FIGURE 1.
Co-assembly of EAAT3 and EAAT4. A, YFP and His fusion proteins differ in size, allowing distinction of homo- and heterotrimeric proteins by gel electrophoresis. B, BN-PAGE of homogenates and eluates from Ni2+-affinity chromatography from cells co-expressing His-EAAT3 and YFP-EAAT4 (lane 3 and 4). The trimeric membrane protein P2X1 was used as size standard (lane 5). C, SDS-PAGE from various fractions obtained by a pulldown assay using Ni2+-affinity chromatography. D, BN-PAGE of lysates and eluted proteins after Ni2+-affinity chromatography from cells expressing YFP-hEAAT2 (third and fourth lanes) or cells co-expressing His-rEAAT1 and YFP-hEAAT2 (fifth and sixth lanes) as well as His-hEAAT3 and YFP-hEAAT2 (seventh and eighth lanes). Eluates were concentrated 8-fold. E, SDS-PAGE from various fractions obtained by Ni2+-affinity chromatography from cells co-expressing His-rEAAT1 and YFP-hEAAT2, His-hEAAT2 and GFP-hEAAT3.
FIGURE 2.
FIGURE 2.
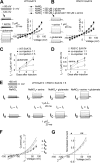
EAAT3 modifies membrane surface insertion and function of EAAT4. A and B, representative recordings and current-voltage relationships from oocytes expressing WT EAAT3 (A) or R501C EAAT4 (B) in the following conditions, 96 mm NaNO3 (filled circles), 96 mm NaNO3 + 500 μm l-glutamate (upward triangles), and 96 mm NaNO3 + 500 μm l-serine (downward triangles). Mean ± S.E. from 6–7 experiments is shown. C and D, dependences of the glutamate-induced (C) and serine-induced (D) currents on the time after mRNA injection for oocytes expressing WT EAAT3 (n = 8 for each time point), R501C EAAT4 (5 < n > 10), and oocytes co-expressing WT EAAT3 and R501C EAAT4 (5 < n > 10) at different ratios. E, representative recordings from an oocyte co-expressing hEAAT3 and R501C rEAAT4 without substrate (I1) in the presence of 96 mm NaNO3 + 500 μm l-serine (I2) or 500 μm l-glutamate (I3), or after application of both (I4). F, current-voltage relationship for serine-activated (IA = I2I1) and glutamate-activated (IB = I3I1) currents as well as of currents activated in the simultaneous presence of serine and glutamate (IC = I4I1) from the example shown in E. The solid line gives the sum of serine- and glutamate-activated current amplitudes. G, averaged normalized current-voltage relationship for different substrate-sensitive current components (n = 6, *, p < 0.05; **, p < 0.01).
FIGURE 3.
FIGURE 3.
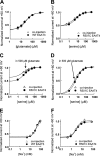
Substrates bind independently to individual subunits. A, glutamate dependence of isochronal current amplitudes measured at +60 mV from oocytes expressing WT EAAT3 (filled circles, n = 3, KD = 23.4 ± 1.2 μm) and oocytes co-expressing WT EAAT3 and R501C EAAT4 (open triangles, n = 6, KD = 26.0 ± 2.4 μm) in the absence of serine. B, serine dependence of isochronal current amplitudes from oocytes expressing R501C EAAT4 (filled circles, n = 3, KD = 6.1 ± 0.1 μm) or co-expressing WT EAAT3 and R501C EAAT4 (open triangles, n = 6, KD = 4.6 ± 0.7 μm) in the absence of glutamate. C, comparison of the serine dependence of isochronal current amplitudes from oocytes expressing R501C EAAT4 (shown in B) with the serine dependence from oocytes co-expressing WT EAAT3 and R501C EAAT4 in the presence of 500 μm glutamate (open triangles, n = 5, KD = 4.6 ± 0.2 μm). D, serine dependence of substrate-dependent anion current amplitudes. Data from C were scaled by setting the minimum values to 0 and the maximum values to 1. E, sodium dependence of isochronal current amplitudes from oocytes expressing WT EAAT3 (filled circles, n = 5, KD = 38.2 ± 0.8 mm) and oocytes co-expressing WT EAAT3 and R501C EAAT4 (open triangles, n = 8, KD = 42.5 ± 0.5 mm) in the presence of 500 μm l-glutamate. F, sodium dependence of the isochronal current amplitude from oocytes expressing R501C EAAT4 (closed circles, n = 6, KD = 6.4 ± 1.4 mm) or co-expressing WT EAAT3 and R501C EAAT4 (open triangles, n = 4, KD = 5.5 ± 0.5 mm) in the presence of 500 μm l-serine.
FIGURE 4.
FIGURE 4.
Substrate translocation occurs independently by individual subunits. A, typical exchange transport current recordings (in the absence of permeating anions) after laser pulse photolytic release of glutamate at t = 0 with cells expressing WT EAAT3 alone or co-expressing WT EAAT3 and R501C EAAT4 (internal solution contained 140 mm NaMES and 10 mm glutamate and serine, exchange mode). The presence of R501C EAAT4 was tested by applying a saturating serine concentration in the anion-conducting mode. The decay of the transport current is biphasic in both cases and could be fit with a sum of two exponentials, yielding two time constants. B, quantification of the time constants associated with the rapidly and slowly decaying phases of the exchange transport current for WT EAAT3-expressing cells (black, n = 3) and R501C EAAT4 + WT EAAT3-expressing cells (grey, n = 3). C and D, typical anion current recordings (inward current caused predominantly by outflow of the highly permeant anion SCN) after laser pulse photolytic release of glutamate at t = 0 with cells expressing WT EAAT3 alone or co-expressing WT EAAT3 and R501C EAAT4 in the absence (grey traces) and presence (black traces) of serine (internal solution contained 140 mm NaSCN and 10 mm glutamate and serine, exchange mode). In C, the baseline current of the black trace is increased due to the continuous presence of serine, preactivating R501C EAAT4. In the absence of R501C EAAT4, serine had no effect. The rise of the current was fit with a sum of two exponentials, yielding two time constants. E and F, quantification of the time constants associated with the rapidly (open bars) and slowly (gray bars) rising phases of the exchange anion current for R501C EAAT4 + WT EAAT3-expressing cells (E, n = 3) and WT EAAT3-expressing cells (F, n = 3) in the presence and absence of extracellular serine. Error bars, S.D.
FIGURE 5.
FIGURE 5.
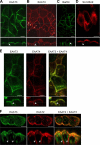
Epithelial sorting of homo- and heterotrimeric EAATs observed by confocal imaging. A–D, confocal images of MDCK cells that transiently express CFP-hEAAT3 (A), YFP-rEAAT4 (B), barttin-YFP (C), or hSLC26A9-YFP (D). E, co-expression of CFP-EAAT3 and YFP-rEAAT4. CFP is shown in green, and YFP is shown in red. This color code results in an orange coloring of regions where both proteins overlap. Individual YFP and CFP fluorescences are added to demonstrate co-localization of hEAAT3 and rEAAT4. F, co-expression of GFP-hEAAT3 and mCherry-hEAAT2. GFP is shown in green, and mCherry is shown in red. GFP and mCherry fluorescences are added to demonstrate co-localization of hEAAT3 and hEAAT2. Arrows indicate basolateral membranes. x-y projections (front view) are given in the upper part, x-z projections (side view) in the lower part. Scale bar, 5 μm.
FIGURE 6.
FIGURE 6.
Epithelial sorting of homo- and heterotrimeric EAATs studied by cell surface biotinylation. A, fluorescent scans of SDS-PAGE of GFP-hEAAT3 purified by surface biotinylation from basolateral and apical membranes of MDCK cells expressing GFP-hEAAT3 alone or together with untagged rEAAT4 or hEAAT2. Control blots show that Na+,K+-ATPase is detected at the basolateral but not the apical cell surface fraction, whereas heterologously expressed SLC26A9-mYFP is predominantly present in the apical membrane. Actin was only detected in the intracellular fraction. B and C, relative amounts of EAAT3 protein in the apical and the basolateral membrane when expressed alone or together with rEAAT4 (B) or hEAAT2 (C). GFP-EAAT3 was surface-biotinylated from the apical or the basolateral membrane, quantified by GFP fluorescence, and given as relative amount of the total surface fluorescence. Data represent means ± S.E. (error bars) from three experiments. Level of significance: *, p < 0.05; **, p < 0.01. Solid lines give the proportion of the apical marker protein hSLC26A9 in basolateral or apical fractions.

References

    1. Danbolt N. C. (2001) Prog. Neurobiol. 65, 1–105 - PubMed
    1. Amara S. G., Fontana A. C. (2002) Neurochem. Int. 41, 313–318 - PubMed
    1. Levy L. M., Warr O., Attwell D. (1998) J. Neurosci. 18, 9620–9628 - PMC - PubMed
    1. Zerangue N., Kavanaugh M. P. (1996) Nature 383, 634–637 - PubMed
    1. Wadiche J. I., Amara S. G., Kavanaugh M. P. (1995) Neuron 15, 721–728 - PubMed

Publication types

MeSH terms

Substances