. 2011 Feb;4(1):26-35.
doi: 10.1161/CIRCGENETICS.110.941757. Epub 2010 Dec 2.

Gene coexpression network topology of cardiac development, hypertrophy, and failure

Affiliations

Gene coexpression network topology of cardiac development, hypertrophy, and failure

Frederick E Dewey et al. Circ Cardiovasc Genet. 2011 Feb.

Abstract

Background: Network analysis techniques allow a more accurate reflection of underlying systems biology to be realized than traditional unidimensional molecular biology approaches. Using gene coexpression network analysis, we define the gene expression network topology of cardiac hypertrophy and failure and the extent of recapitulation of fetal gene expression programs in failing and hypertrophied adult myocardium.

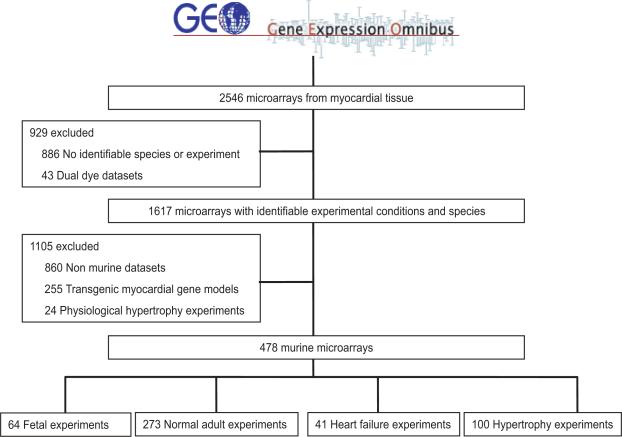
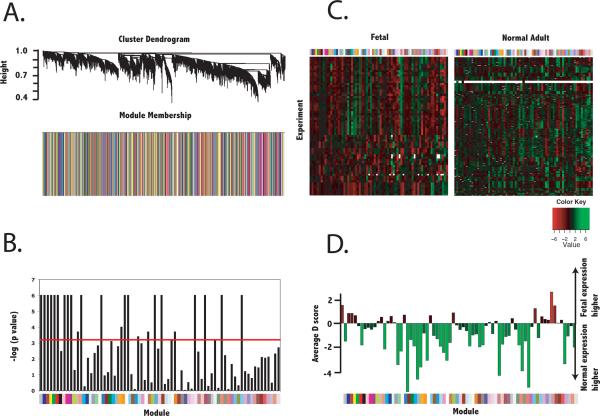
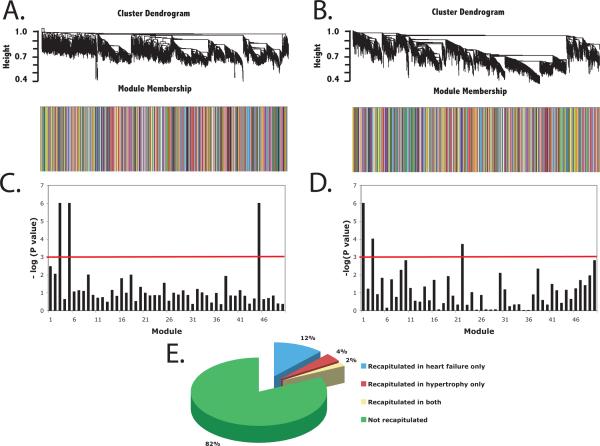
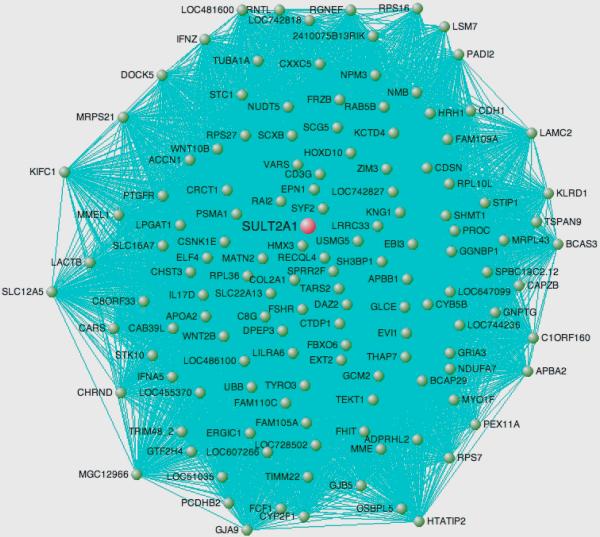
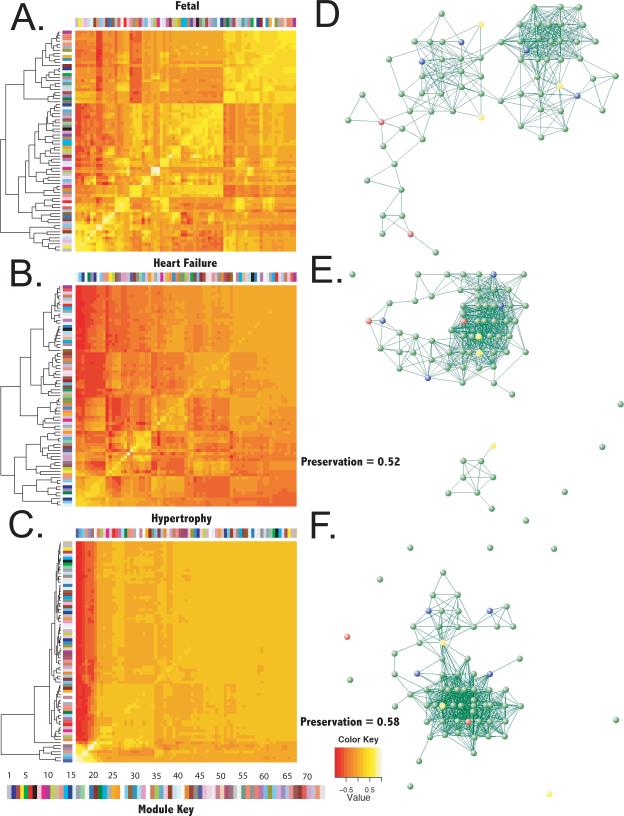
Methods and results: We assembled all myocardial transcript data in the Gene Expression Omnibus (n=1617). Because hierarchical analysis revealed species had primacy over disease clustering, we focused this analysis on the most complete (murine) dataset (n=478). Using gene coexpression network analysis, we derived functional modules, regulatory mediators, and higher-order topological relationships between genes and identified 50 gene coexpression modules in developing myocardium that were not present in normal adult tissue. We found that known gene expression markers of myocardial adaptation were members of upregulated modules but not hub genes. We identified ZIC2 as a novel transcription factor associated with coexpression modules common to developing and failing myocardium. Of 50 fetal gene coexpression modules, 3 (6%) were reproduced in hypertrophied myocardium and 7 (14%) were reproduced in failing myocardium. One fetal module was common to both failing and hypertrophied myocardium.

Conclusions: Network modeling allows systems analysis of cardiovascular development and disease. Although we did not find evidence for a global coordinated program of fetal gene expression in adult myocardial adaptation, our analysis revealed specific gene expression modules active during both development and disease and specific candidates for their regulation.


Figures

Figure 1
Figure 1
Myocardial gene microarray expression data used in analysis. All murine microarray data from the Gene Expression Omnibus (GEO) database were queried with the search terms heart, myocardium, and cardiovascular.
Figure 2
Figure 2
Identification of gene coexpression modules specific to fetal tissue. Gene-gene adjacencies were first defined by the topological overlap, which quantifies the degree of shared network neighbors given by gene-wise Pearson correlation. Hierarchical clustering of adjacencies was first performed in the training dataset of 43 fetal samples and resulting coexpression modules were evaluated for significant reproducibility in the validation dataset of 21 fetal samples. The seventy-two valid fetal modules were evaluated for reproducibility in normal adult myocardium as well as differential expression. A.) Cluster dendrogram and barplot describing module membership (according to clusters derived in the training fetal dataset) for normal adult myocardium. B.) Reproducibility of valid fetal modules in normal adult myocardium. Colors below the bargraph correspond to the module membership. Red line indicates cutoff for statistical significance (p < 6.9× 10⁻⁴ or − log(p value) > 3.16). Modules below this cutoff were defined as having topology specific to fetal myocardium and defined as fetal modules. C.) Heatmap of average expression of each module in fetal and normal adult myocardium. Colors above the heatmaps correspond to module membership. D.) Average significance level of differential expression (average Significance Analysis of Microarrays d score) for each module. Negative values correspond to lower expression levels in normal than fetal myocardium.
Figure 3
Figure 3
Reproducibility of developmental gene modules in heart failure and cardiac hypertrophy. The modules unique to fetal myocardium were evaluated for reproducibility in heart failure and cardiac hypertrophy. Cluster dendrograms and barplots describe module membership (according to clusters derived in the training fetal dataset) for A.) myocardium in murine heart failure and B.) myocardium in murine cardiac hypertrophy. Bargraphs describe significance of module reproducibility in C.) heart failure and D.) cardiac hypertrophy. Colors below the bargraphs correspond to the module membership. Red line indicates cutoff for statistical significance (p < 0.001 or − log(p value) > 3). E.) Proportion of fetal gene modules recapitulated in heart failure only, cardiac hypertrophy only, both, or neither.
Figure 4
Figure 4
Topology of gene coexpression module common to developing myocardium and hypertrophied and failing myocardium. The hub gene is colored red and all nodes are colored green. Only edges with adjacency weight > 0.7 are shown for clarity. The proximity of each gene to the center of the figure indicates its connectivity, or sum of connection weights. Genes with connectivity < 50 are omitted for clarity.
Figure 5
Figure 5
Reproducibility of higher-order network topology between fetal myocardium and myocardium in murine heart failure and cardiac hypertrophy. Singular value decomposition was used to generate a representative eigengene for each fetal module that described most of the variance in modular gene expression. Hierarchical clustering of eigengenes was then used to identify inter-modular connections. Heatmaps describe the correlation between eigengenes and the dendrograms represent clustering of module eigengenes in A.) fetal myocardium, B.) myocardium in murine heart failure, and C.) myocardium in cardiac hypertrophy. Colors to the left and top of each heatmap correspond to each module and the color of each block represents the pairwise correlation between eigengene expression across all experiments (thus the line of identity has correlation = 1 for all modules). The color bar at bottom maps colors to eigengene identifiers (i.e., 1 = ME1). Graphical representation of eigengene networks is represented for fetal myocardium in D.), heart failure in E.), and cardiac hypertrophy in F.). Nodes colored red were reproduced in both heart failure and cardiac hypertrophy, nodes colored yellow were reproduced in heart failure only and those colored blue were reproduced in hypertrophy only. Values given for preservation refer to preservation of fetal inter-modular connections in heart failure and cardiac hypertrophy.

Comment in

References

    1. Jhund PS, Macintyre K, Simpson CR, Lewsey JD, Stewart S, Redpath A, Chalmers JW, Capewell S, McMurray JJ. Long-term trends in first hospitalization for heart failure and subsequent survival between 1986 and 2003: a population study of 5.1 million people. Circulation. 2009;119:515–523. - PubMed
    1. Feldman AM, Weinberg EO, Ray PE, Lorell BH. Selective changes in cardiac gene expression during compensated hypertrophy and the transition to cardiac decompensation in rats with chronic aortic banding. Circ Res. 1993;73:184–192. - PubMed
    1. Lyn D, Liu X, Bennett NA, Emmett NL. Gene expression profile in mouse myocardium after ischemia. Physiol Genomics. 2000;2:93–100. - PubMed
    1. Yue P, Long CS, Austin R, Chang KC, Simpson PC, Massie BM. Post-infarction heart failure in the rat is associated with distinct alterations in cardiac myocyte molecular phenotype. J Mol Cell Cardiol. 1998;30:1615–1630. - PubMed
    1. Rajabi M, Kassiotis C, Razeghi P, Taegtmeyer H. Return to the fetal gene program protects the stressed heart: a strong hypothesis. Heart Fail Rev. 2007;12:331–343. - PubMed

Publication types

Substances