. 2010 Dec 3;330(6009):1385-9.
doi: 10.1126/science.1195618.

Rewiring of genetic networks in response to DNA damage

Affiliations

Rewiring of genetic networks in response to DNA damage

Sourav Bandyopadhyay et al. Science. .

Erratum in

  • Science. 2011 Jan 21;331(6015):284

Abstract

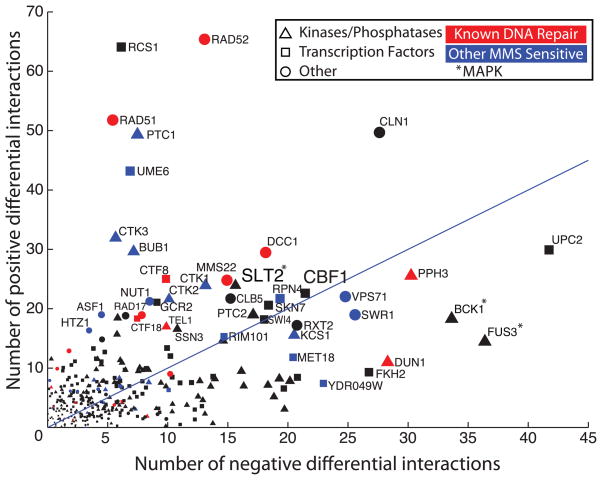
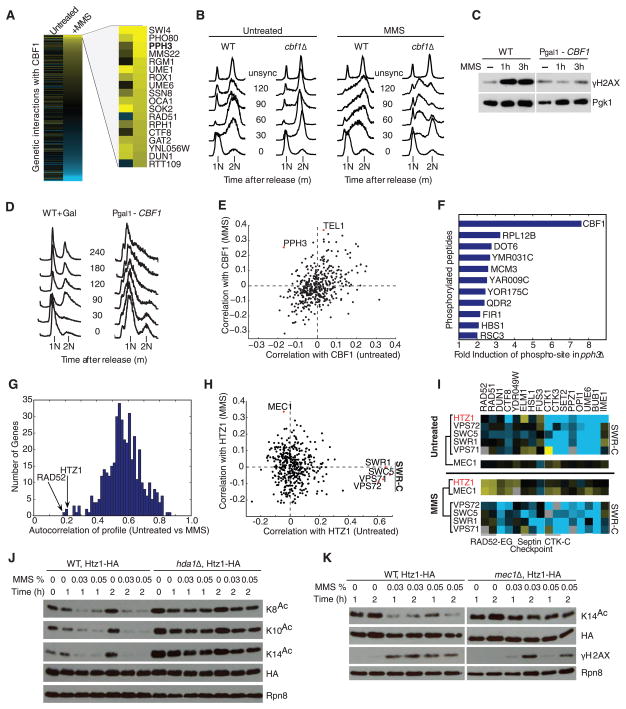
Although cellular behaviors are dynamic, the networks that govern these behaviors have been mapped primarily as static snapshots. Using an approach called differential epistasis mapping, we have discovered widespread changes in genetic interaction among yeast kinases, phosphatases, and transcription factors as the cell responds to DNA damage. Differential interactions uncover many gene functions that go undetected in static conditions. They are very effective at identifying DNA repair pathways, highlighting new damage-dependent roles for the Slt2 kinase, Pph3 phosphatase, and histone variant Htz1. The data also reveal that protein complexes are generally stable in response to perturbation, but the functional relations between these complexes are substantially reorganized. Differential networks chart a new type of genetic landscape that is invaluable for mapping cellular responses to stimuli.


Figures

Fig. 1
Fig. 1
An epistasis map for DNA damage signaling. (A) Comparison of genetic interactions (positive, S ≥ +2; negative, S ≤ −2.5) uncovered in untreated or DNA damage treated (+MMS) conditions. Control represents interactions from two independent experiments in untreated conditions. (B) Percentage of interactions (positive or negative) identified in each condition that are specific to that condition. (C) Differences between the untreated and treated maps identify differential interactions. (D) Scatter of S scores between untreated and treated maps and identification of positive differential (green, P ≤ 0.001) and negative differential interactions (red, P ≤ 0.001). (E) Enrichment of interactions involving known DNA repair genes, shown for static and differential networks and including both positive and negative interactions. For the right-most bar, all differential interactions also identified in the static network are removed. (F) Enrichment of interactions involving genes with various functions (10).
Fig. 2
Fig. 2
Identification of differential genetic interaction hubs. The scatterplot shows the number of positive and negative differential interactions associated with each gene in this study. The 30 genes whose deletions are the most sensitive to MMS are indicated (blue) (24), excluding those already known to function in DNA repair (red) (table S1).
Fig. 3
Fig. 3
Differential genetic interactions identify novel DNA damage–dependent pathways. (A) Full profile of CBF1 genetic interactions with the strongest positive genetic interactions in MMS highlighted. (B) Fluorescence-activated cell sorting (FACS) analysis of cell cycle progression in alpha-factor–arrested wild-type and cbf1Δ cells released into media with or without MMS. In MMS, cbf1Δ cells bypass cell cycle checkpoints and eventually accumulate in S phase (between 1N and 2N DNA content). (C) γH2AX levels for wild-type and CBF1 overexpression at times indicated after exposure to MMS. Pgk1 is used as a loading control. (D) Effect of CBF1 overexpression on cell cycle progression using FACS. (E) Correlation coefficients between the CBF1 genetic interaction profile and that of each gene in the epistasis map, in MMS versus untreated conditions. (F) Top changes in abundance of phosphorylated peptides in pph3Δ versus wild-type cells by phosphoproteomic profiling. (G) Histogram of autocorrelation coefficients. For each gene, the genetic interaction profiles before and after MMS exposure are compared by Pearson correlation. (H) Correlation plot as in (E) for HTZ1. (I) Representative genetic interactions ofHTZ1, MEC1, and SWR-C members. Clustering based on similarity of profiles is shown. (J) The acetylation of multiple Htz1 N-terminal lysine residues (K8, K10, or K14) measured in an Htz1-3HA strain after MMS exposure in wild-type (WT) and hda1Δ backgrounds. HA represents total amount of Htz1. Rpn8 is a loading control. (K) Acetylation status of Htz1-K14 in response to MMS in WT and mec1Δ backgrounds. γH2AX is a downstream marker of DNA-damage signaling by Mec1.
Fig. 4
Fig. 4
Module-based interpretation of differential genetic interactions. (A) MMS induces a set of positive interactions between DNA damage pathways (top right) that are not evident in untreated conditions (bottom left). (B) Module map of protein complexes and pathways connected by differential genetic interaction bundles. Node color represents the most severe single-deletion phenotype among members of a module (table S1). (C) Detailed view of differential genetic interactions between protein complexes corresponding to selected modules in (B) (dotted node borders). For clarity, only physical interactions and differential genetic interactions with P < 0.01 are shown. Thickness is scaled with increasing significance of the P value (10).

Comment in

  • Genetics. The DNA damage road map.
    Friedman N, Schuldiner M. Friedman N, et al. Science. 2010 Dec 3;330(6009):1327-8. doi: 10.1126/science.1199862. Science. 2010. PMID: 21127235 No abstract available.

References

    1. Boone C, Bussey H, Andrews BJ. Nat Rev Genet. 2007;8:437. - PubMed
    1. Costanzo M, et al. Science. 2010;327:425. - PubMed
    1. Pan X, et al. Cell. 2006;124:1069. - PubMed
    1. Lehner B, Crombie C, Tischler J, Fortunato A, Fraser AG. Nat Genet. 2006;38:896. - PubMed
    1. Roguev A, et al. Science. 2008;322:405. - PMC - PubMed

Publication types

MeSH terms