. 2010 Dec 21;107(51):22111-6.
doi: 10.1073/pnas.1006591107. Epub 2010 Dec 2.

Video force microscopy reveals the mechanics of ventral furrow invagination in Drosophila

Affiliations

Video force microscopy reveals the mechanics of ventral furrow invagination in Drosophila

G Wayne Brodland et al. Proc Natl Acad Sci U S A. .

Abstract

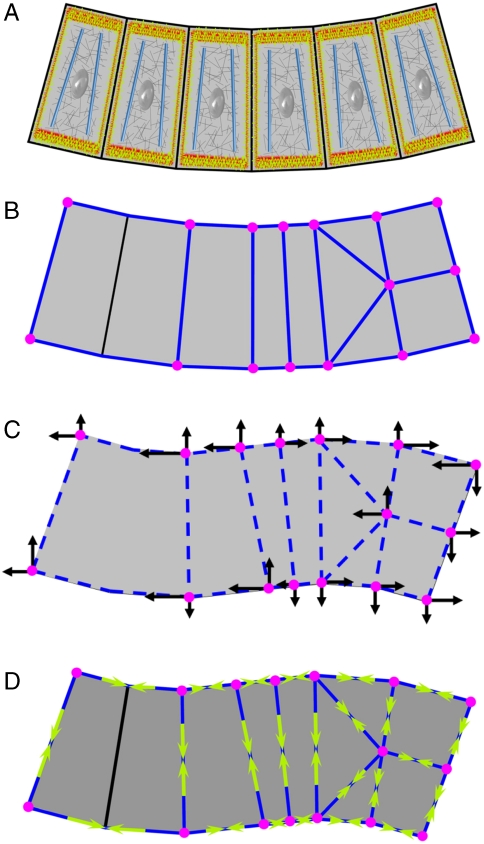
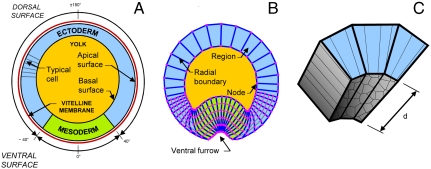
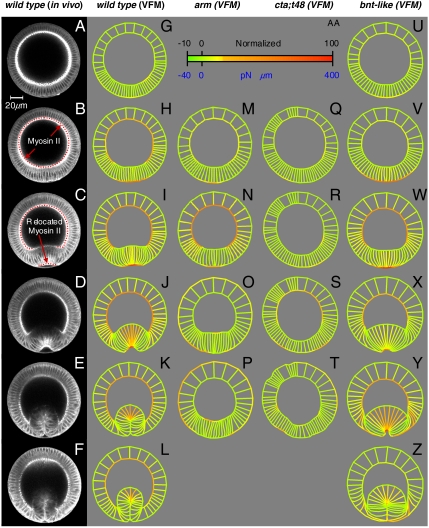
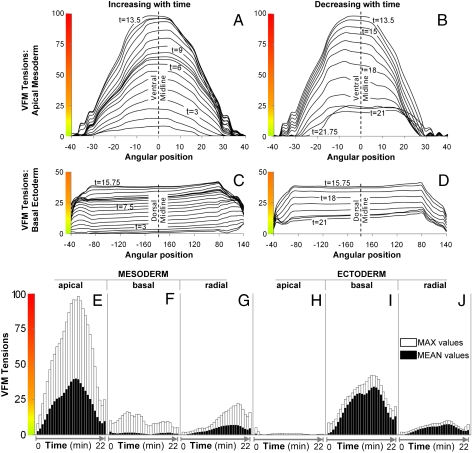
The absence of tools for mapping the forces that drive morphogenetic movements in embryos has impeded our understanding of animal development. Here we describe a unique approach, video force microscopy (VFM), that allows detailed, dynamic force maps to be produced from time-lapse images. The forces at work in an embryo are considered to be decomposed into active and passive elements, where active forces originate from contributions (e.g., actomyosin contraction) that do mechanical work to the system and passive ones (e.g., viscous cytoplasm) that dissipate energy. In the present analysis, the effects of all passive components are considered to be subsumed by an effective cytoplasmic viscosity, and the driving forces are resolved into equivalent forces along the edges of the polygonal boundaries into which the region of interest is divided. Advanced mathematical inverse methods are used to determine these driving forces. When applied to multiphoton sections of wild-type and mutant Drosophila melanogaster embryos, VFM is able to calculate the equivalent driving forces acting along individual cell edges and to do so with subminute temporal resolution. In the wild type, forces along the apical surface of the presumptive mesoderm are found to be large and to vary parabolically with time and angular position, whereas forces along the basal surface of the ectoderm, for example, are found to be smaller and nearly uniform with position. VFM shows that in mutants with reduced junction integrity and myosin II activity, the driving forces are reduced, thus accounting for ventral furrow failure.


Conflict of interest statement

The authors declare no conflict of interest.

Figures

Fig. 1.
Fig. 1.
An illustration of the VFM method. A shows a cross-section through a generic epithelium. Active components in the cells are shown in color and passive ones in gray. (B) A polygonal partitioning of the epithelium at time t. (C) At time t + Δt, the example epithelium has adopted a new, deformed geometry. To deform the passive cellular components from geometry (B to C), the forces shown as black arrows must be applied at the registration points (magenta) for duration Δt. These forces are computed using a finite element procedure (24). (D) VFM calculates the edge forces (yellow arrows) and intracellular pressures (not shown) that must act in concert to produce the set of forces shown in C.
Fig. 2.
Fig. 2.
VFM as applied to Drosophila cross-sections. A shows a transverse cross-section through a Drosophila embryo. The tissue spanning an angle of approximately ± 40° in this figure will eventually form part of the ventral furrow (B), and it is denoted mesoderm, whereas the balance of the epithelium is called ectoderm. B shows the associated VFM mesh several minutes later, when the ventral furrow is becoming evident. The mesh is “Lagrangian,” following the tissue it represents. The thin gray edges that divide the cells on the ventral aspect of the embryo are assumed to carry zero load. C shows the cells in a volume of length d along the anterior–posterior axis of the embryo corresponding to three of the regions shown in cross-section in B. Note that even if the regions are made exactly one cell wide, they will always represent parts of cells and possibly multiple cells (depending on the value of d). The VFM edge forces reported in the cross-sections of Fig. 3 are those generated by the cells in the corresponding extruded volumes.
Fig. 3.
Fig. 3.
Driving forces as determined by VFM. (AF) Selected multiphoton images of transverse cross-sections of a WT embryo during ventral furrow formation labeled with Sqh-GFP. Embryos are oriented with their dorsal surface upward, and the time interval between successive frames is 4.5 min. GL show the driving forces in a WT embryo as determined by VFM. The meshes in GL were formed by placing a grid on image A and tracking its corners throughout the image sequence (see also Movie S1). The region boundaries were then colored according to the spectrum shown in AA to represent the driving forces (Fig. 1D) calculated by VFM. The spectrum is calibrated so as to give forces in terms of arbitrary units and so as to give dimensioned forces per microns of embryo length on the basis of the μ value shown in the text. Radial forces have been normalized to the length of the circumferential region they represent in the initial geometry. (MP) Forces in an arm mutant, which lacks strong apical junctions. (QT) Forces in a cta;t48 mutant, in which apical constriction is completely abolished. Forces in a bnt mutant (UZ), where germ-band extension and posterior midgut invagination are suppressed. Embryos were synchronized using apical–basal cell height profiles (see Figs. S1 and S2).
Fig. 4.
Fig. 4.
Tension profiles. Tension along the apical surface of the ectoderm (A, B, and E) is approximately parabolic with respect to space and time and the apical–basal lengths of the dorsal cells (Fig. S2) peak at the same time as the driving forces. In contrast, forces along the basal surface of the ectoderm (C and D) are highly uniform along the most dorsal 70% of the tissue. They are substantially smaller than those in the mesoderm and they peak later (E and I). Maximum cell height and peak force again coincide. The histograms (EJ) show the maximum forces (white bars) and mean forces (black bars) present along the apical, basal, and radial edges of the mesodermal and ectodermal cells over time. Substantial differences in magnitude and profile are apparent.

References

    1. Puech P, et al. Measuring cell adhesion forces of primary gastrulating cells from zebrafish using atomic force microscopy. J Cell Sci. 2005;118:4199–4206. - PubMed
    1. Krieg M, et al. Tensile forces govern germ-layer organization in zebrafish. Nat Cell Biol. 2008;10:429–436. - PubMed
    1. Hutson MS, et al. Combining laser microsurgery and finite element modeling to assess cell-level epithelial mechanics. Biophys J. 2009;97:3075–3085. - PMC - PubMed
    1. Conte V, Muñoz JJ, Baum B, Miodownik M. Robust mechanisms of ventral furrow invagination require the combination of cellular shape changes. Phys Biol. 2009;6:016010,. 10.1088/1478-3975/6/1/016010. - PubMed
    1. Chen X, Brodland GW. Multi-scale finite element modeling allows the mechanics of amphibian neurulation to be elucidated. Phys Biol. 2008;5:015003. 10.1088/1478-3975/5/1/015003. - PubMed

Publication types