

Evolution of domain promiscuity in eukaryotic genomes--a perspective from the inferred ancestral domain architectures
- PMID: 21127809
- PMCID: PMC3321261
- DOI: 10.1039/c0mb00182a
Evolution of domain promiscuity in eukaryotic genomes--a perspective from the inferred ancestral domain architectures
Abstract
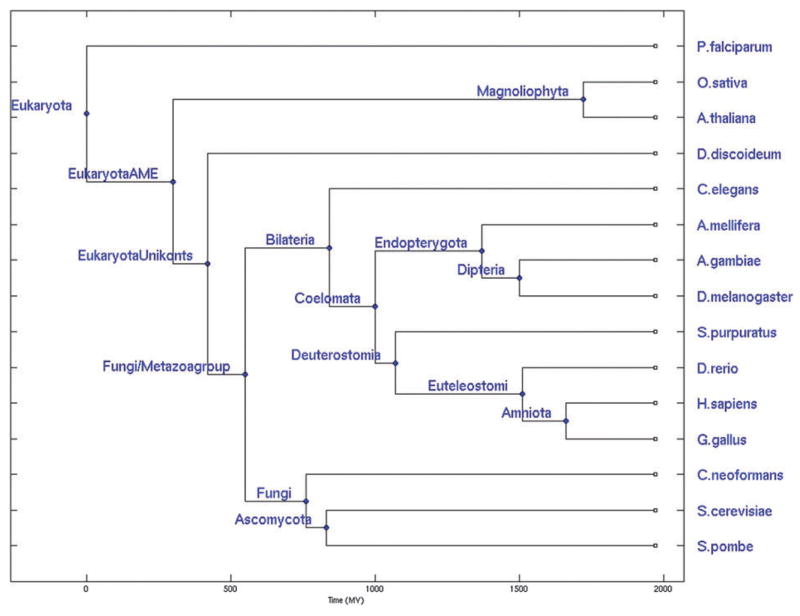
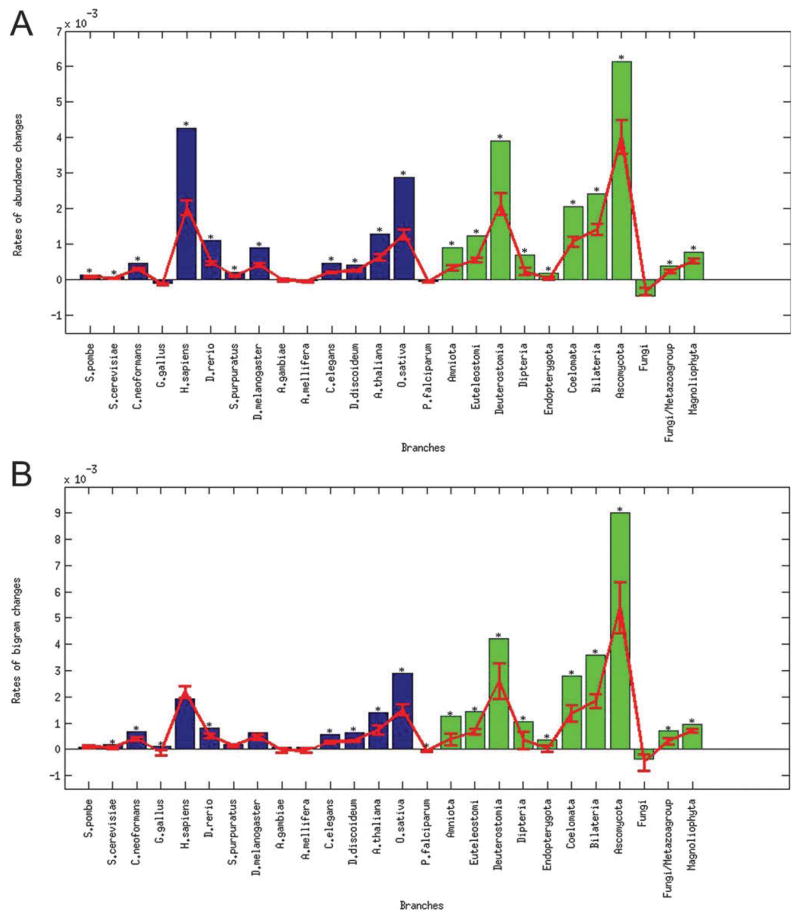
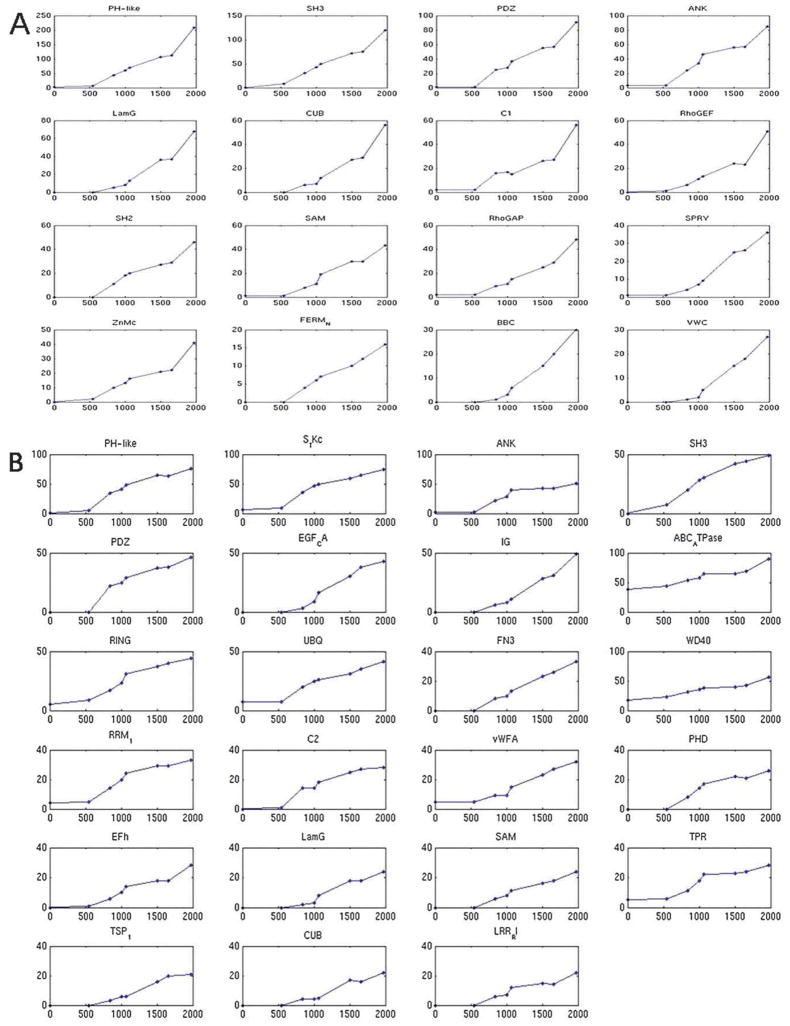
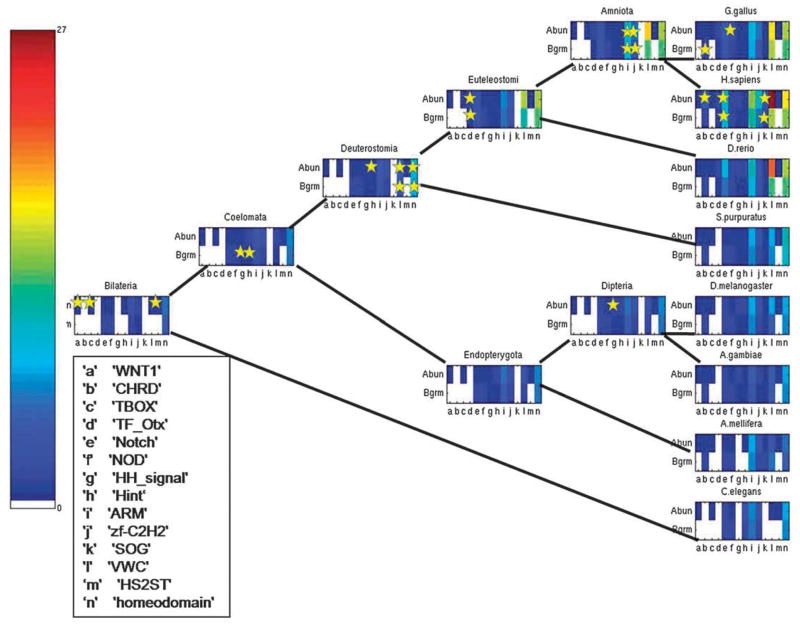
Most eukaryotic proteins are composed of two or more domains. These assemble in a modular manner to create new proteins usually by the acquisition of one or more domains to an existing protein. Promiscuous domains which are found embedded in a variety of proteins and co-exist with many other domains are of particular interest and were shown to have roles in signaling pathways and mediating network communication. The evolution of domain promiscuity is still an open problem, mostly due to the lack of sequenced ancestral genomes. Here we use inferred domain architectures of ancestral genomes to trace the evolution of domain promiscuity in eukaryotic genomes. We find an increase in average promiscuity along many branches of the eukaryotic tree. Moreover, domain promiscuity can proceed at almost a steady rate over long evolutionary time or exhibit lineage-specific acceleration. We also observe that many signaling and regulatory domains gained domain promiscuity around the Bilateria divergence. In addition we show that those domains that played a role in the creation of two body axes and existed before the divergence of the bilaterians from fungi/metazoan achieve a boost in their promiscuities during the bilaterian evolution.
Figures
Similar articles
-
Evolution of protein domain promiscuity in eukaryotes.Genome Res. 2008 Mar;18(3):449-61. doi: 10.1101/gr.6943508. Epub 2008 Jan 29. Genome Res. 2008. PMID: 18230802 Free PMC article.
-
Domain mobility in proteins: functional and evolutionary implications.Brief Bioinform. 2009 May;10(3):205-16. doi: 10.1093/bib/bbn057. Epub 2009 Jan 16. Brief Bioinform. 2009. PMID: 19151098 Free PMC article.
-
Evolution of the PWWP-domain encoding genes in the plant and animal lineages.BMC Evol Biol. 2012 Jun 26;12:101. doi: 10.1186/1471-2148-12-101. BMC Evol Biol. 2012. PMID: 22734652 Free PMC article.
-
Evolution of protein domain architectures.Methods Mol Biol. 2012;856:187-216. doi: 10.1007/978-1-61779-585-5_8. Methods Mol Biol. 2012. PMID: 22399460 Review.
-
Comparative genomics of transcription factors and chromatin proteins in parasitic protists and other eukaryotes.Int J Parasitol. 2008 Jan;38(1):1-31. doi: 10.1016/j.ijpara.2007.07.018. Epub 2007 Sep 15. Int J Parasitol. 2008. PMID: 17949725 Review.
Cited by
-
Experimental recombining of repetitive motifs leads to large functional metallothioneins and demonstrates their modular evolvability potential.Protein Sci. 2025 Jan;34(1):e5247. doi: 10.1002/pro.5247. Protein Sci. 2025. PMID: 39673460 Free PMC article.
-
Structure function relations in PDZ-domain-containing proteins: Implications for protein networks in cellular signalling.J Biosci. 2018 Mar;43(1):155-171. J Biosci. 2018. PMID: 29485124 Review.
-
Exploring metazoan evolution through dynamic and holistic changes in protein families and domains.BMC Evol Biol. 2012 Aug 3;12:138. doi: 10.1186/1471-2148-12-138. BMC Evol Biol. 2012. PMID: 22862991 Free PMC article.
-
Dynamics and adaptive benefits of protein domain emergence and arrangements during plant genome evolution.Genome Biol Evol. 2012;4(3):316-29. doi: 10.1093/gbe/evs004. Epub 2012 Jan 16. Genome Biol Evol. 2012. PMID: 22250127 Free PMC article.
-
Event inference in multidomain families with phylogenetic reconciliation.BMC Bioinformatics. 2015;16 Suppl 14(Suppl 14):S8. doi: 10.1186/1471-2105-16-S14-S8. Epub 2015 Oct 2. BMC Bioinformatics. 2015. PMID: 26451642 Free PMC article.
References
-
- Koonin EV, Aravind L, Kondrashov AS. Cell. 2000;101:573–576. - PubMed
-
- Ekman D, Bjorklund AK, Frey-Skott J, Elofsson A. J Mol Biol. 2005;348:231–243. - PubMed
-
- Apic G, Gough J, Teichmann SA. J Mol Biol. 2001;310:311–325. - PubMed
-
- Apic G, Huber W, Teichmann SA. J Struct Funct Genomics. 2003;4:67–78. - PubMed
-
- Vogel C, Teichmann SA, Pereira-Leal J. J Mol Biol. 2005;346:355–365. - PubMed
Publication types
MeSH terms
Substances
Grants and funding
LinkOut - more resources
Full Text Sources