. 2011 Feb;461(2):277-94.
doi: 10.1007/s00424-010-0900-7. Epub 2010 Dec 3.

Feedforward and recurrent inhibitory receptive fields of principal cells in the cat's dorsal lateral geniculate nucleus

Affiliations

Feedforward and recurrent inhibitory receptive fields of principal cells in the cat's dorsal lateral geniculate nucleus

Sivert Lindström et al. Pflugers Arch. 2011 Feb.

Abstract

Principal cells in the dorsal lateral geniculate nucleus receive both feedforward and recurrent inhibition. Despite many years of study, the receptive field structure of these inhibitory mechanisms has not been determined. Here, we have used intracellular recordings in vivo to differentiate between the two types of inhibition and map their respective receptive fields. The feedforward inhibition of a principal cell originates from the same type of retinal ganglion cells as its excitation, while the recurrent inhibition is provided by both on- and off-centre cells. Both inhibitory effects are strongest at the centre of the excitatory receptive field. The diameter of the feedforward inhibitory field is two times larger, and the recurrent two to four times larger than the excitatory field centre. The inhibitory circuitry is similar for X and Y principal cells.


Figures
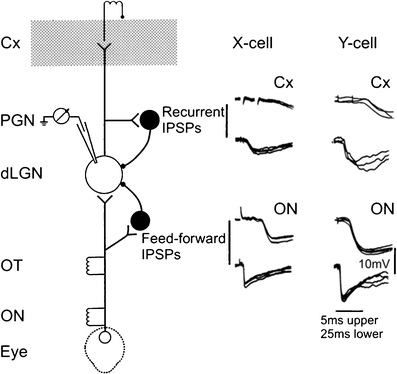
Fig. 1
Fig. 1
Schematic diagram of experimental arrangement and inhibitory pathways of the dLGN. Intracellular recordings of IPSPs obtained from an X on-centre and a Y off-centre principal cell. Upper pairs of records show superimposed traces with recurrent IPSPs evoked by antidromic activation of principal cell axons in the visual cortex (Cx) at an intensity subthreshold for activation of corticogeniculate axons, lower pairs feedforward IPSPs evoked by optic nerve stimulation (ON). The two records in a pair show the same response displayed with different time resolution. Note difference in time course of recurrent and feedforward IPSPs and longer latency of the responses in the X cell. The X and Y cells were depolarised by a steady injection of current (4 and 5 nA) through the recording microelectrode. Voltage calibration refers to all records, time calibration is 5 ms for upper record in each pair and 25 ms for lower. PGN Perigeniculate nucleus, dLGN dorsal lateral geniculate nucleus, OT optic tract
Fig. 2
Fig. 2
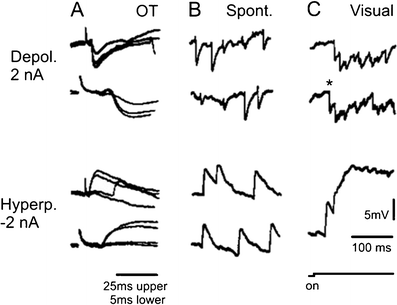
Identification of feedforward IPSPs in an X on-centre principal cell. Records in column A show monosynaptic EPSPs and disynaptic feedforward IPSPs evoked by optic tract (OT) stimulation, each pair is the same response displayed at different time resolution. Sample records in B show spontaneous activity and those in C responses evoked by flashing a light spot on in the receptive field centre. Upper pairs of records were obtained with the cell depolarised (2 nA), lower pairs during hyperpolarisation (2 nA). The cell was activated by a single retinal ganglion cell. Note fast IPSPs of feedforward type in all responses during depolarization. Most feedforward IPSPs were time-locked to a preceding EPSP (decreased by the depolarisation) at a fixed interval of 0.8 ms. They varied in several discrete steps in amplitude. The second visual response started with a large nonlocked feedforward IPSP (asterisk), another smaller occurred after an EPSP failure with electrical stimulation. Time calibration in A is 25 ms for upper and 5 ms for lower traces in the pair. Time calibration lowermost in C refers to records in B and C, voltage calibration to all records. See text for further details
Fig. 3
Fig. 3
Identification of visually evoked recurrent IPSPs in an X off-centre principal cell. A and B show responses evoked by a light spot turned on and off in the receptive field centre, records in C are PSPs evoked by electrical stimulation of the optic tract (OT). The cell was depolarised and hyperpolarised as indicated to enhance or reverse the recurrent IPSP (upper and lower pair of records in A). Onset of the recurrent IPSP is marked by an arrow in A. Voltage calibration in C refers to all records, time calibration in B is for records in A and B. Diagram in D shows voltage dependence of visually evoked synaptic potentials (means of many records as in A and B) plotted against injected current. Vertical bars represent the 95% CI. Light on and off IPSP values represent peak amplitudes taken at a latency of 90–100 ms after stimulus onset, light off EPSP represents peak EPSP amplitudes at 60–70 ms interval after stimulus off. Diagram in E shows voltage dependence of monosynaptic EPSPs and disynaptic IPSPs evoked by OT stimulation. IPSPs were measured at an interval corresponding to its peak amplitude in depolarised recordings without EPSP subtraction. Note that visually evoked recurrent IPSPs reversed at about the same level of polarisation as feedforward IPSPs
Fig. 4
Fig. 4
Visually evoked feedforward IPSPs in an X off-centre principal cell. A Excitatory response evoked at resting membrane potential level by turning a light spot 1 off in the receptive field centre (action potentials truncated). B Response evoked with the cell depolarised by steady current injection (5 nA). C, D Light off and on responses evoked from different parts of the receptive field as indicated, cell depolarised as in B. E Scheme of the receptive field and outlines of the visual stimuli. The area of the receptive field centre is dotted. F Feedforward and recurrent IPSPs evoked by electrical stimulation of the left optic nerve (LON) and visual cortex (Cx). Voltage calibration is for all records, time calibration in A is for A and B, that lowermost in D is 100 ms for C and D and 10 ms for ON and Cx evoked IPSPs. See text for further details
Fig. 5
Fig. 5
Pattern of feedforward IPSPs in different types of principal cells. First two columns in A–D show three consecutive light on and off responses to a small spot in the receptive field centre; upper two responses in third columns show spontaneous activity and lowest trace a centre response at low time resolution. Note that feedforward IPSPs were evoked at light on in on-centre cells and at light off in off-centre cells, similarly for X and Y cells. Slow hyperpolarising potentials in the opposite phase of stimulation are recurrent IPSPs. The cells were depolarised by the injection of steady current (2–3 nA). Voltage calibration for records in A and B is in B, that for C and D in D. Time calibrations for records in first columns and for spontaneous activity is below second column in D, that for slow recordings below third columns in B and D
Fig. 6
Fig. 6
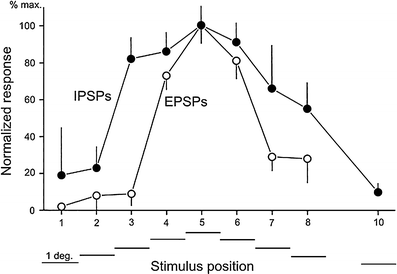
Feedforward inhibitory receptive field profile for an X on-centre principal cell. The diagram shows the relative strength of the excitatory and feedforward inhibitory input to the cell from different positions along an axis through the centre of the receptive field. The size and position of the stimuli are indicated below the diagram. The cell was activated from the ipsilateral eye (lamina A1) and the eccentricity of its receptive field was 7°. The data were obtained by counting all unitary EPSPs and feedforward IPSPs during the first 100 ms after stimulus onset in a number of individual records for each position. The mean values were then normalised and plotted as percentage of the maximal response for each PSP (22.0 and 23.7/100 ms for EPSPs and IPSPs). Vertical bars represent 95% CI. The cell had one large unitary EPSP and both locked and unlocked IPSPs which varied in amplitude in several steps. They were divided into four size categories and each count was then multiplied with the appropriate size factor to obtain weighted means (±95% CI). The spontaneous rate of PSPs is indicated to the right (S). The small points indicate the relative size of averaged feedforward IPSPs from the same stimulus positions, as illustrated by the sample records to the right. The area of the IPSPs was integrated, normalised, and plotted as for the unitary counts. Only the first 70 ms after stimulus on was used since the response at longer intervals was heavily contaminated by recurrent IPSPs. Note that the fast rise times of feedforward IPSPs is smoothed by the averaging. The cell was depolarised by a steady current injection (2 nA) during the data collection. Same cell as in Fig. 2
Fig. 7
Fig. 7
Feedforward inhibitory receptive field profile for a Y on-centre principal cell. The PSPs were estimated and plotted as for Fig. 6. The cell received convergence of excitation from three Y on-centre ganglion cells in the contralateral eye; eccentricity was 11°. Both EPSPs and IPSPs were multiplied by an appropriate size factor before counting. The peak counts from the receptive field centre were 20/100 ms for both PSPs. Before normalisation, the spontaneous rate of PSPs (1.7 and 4.6/100 ms for EPSPs and IPSPs) was subtracted. See text for further details
Fig. 8
Fig. 8
Area response plot for EPSPs and feedforward IPSPs in an X off-centre principal cell. The diagram shows the mean number of unitary EPSPs and feedforward IPSPs evoked at light off by centred spot stimuli of different diameters. The cell received a single unitary EPSP from a ganglion cell in the contralateral eye, eccentricity of receptive field was 16°. The PSPs were counted during the first 100 ms after stimulus onset in a number of individual traces (with the IPSPs multiplied by a size factor of 1 to 3) and normalised with respect to the largest response (13.8 and 25.4/100 ms for the EPSP and IPSP). Vertical bars represent 95% c.i. The spontaneous rates are indicated to the left (s). In the middle are superimposed traces of locked and nonlocked IPSPs of different amplitudes. The responses were sampled during a period of spontaneous activity and each trace is the average of five to six responses of comparable amplitude. Sample records to the right were obtained with a spots of 0.2° and 1.8°, giving the same rate of activity of the excitatory retinal ganglion cell. Note the stronger feedforward inhibition evoked by the larger spot. Arrows point to a few large nonlocked IPSPs. Same cell as in Fig. 4. See text for further details
Fig. 9
Fig. 9
Receptive field profile for recurrent IPSPs in an X off-centre principal cell. The PSPs were evoked by spot stimuli along an axis through the middle of the excitatory centre as indicated below the diagram. The cell received excitation from two retinal ganglion cells in the contralateral eye, eccentricity was 5°. The EPSP profile was determined by unitary counts as before and the recurrent IPSP profiles by integration of the area of averaged inhibitory responses. The latter measurements were restricted to a 60 ms period around the peak of the recurrent IPSP and normalised with respect to the largest response in the light on phase, when the recurrent IPSPs were uncontaminated by EPSPs. Separate plots are shown for responses evoked at light on and off with sample responses from positions 2 and 6 below. The baseline used to estimate the recurrent IPSP in the off mode is indicated by a dotted line. In the off phase, the recurrent IPSPs was measured against a background of summed EPSPs, since we were unable to depolarise this cell sufficiently to completely suppress its excitatory input. To estimate the inhibition, the outline of the EPSP response was extrapolated from records obtained with the cell hyperpolarised to the IPSP reversal level. Even with this correction procedure, the amplitudes of the recurrent IPSPs at light off in the receptive field centre were presumably underestimated. Stimulus Spot 0.4°; response duration 200 ms. See text for further details
Fig. 10
Fig. 10
Recurrent IPSPs evoked in an X off-centre principal cell by stimulus spots of different diameters. The size of the different stimuli in relation to the receptive field centre (dotted) are shown to the right and averages of the corresponding off and on responses to the left. Only recurrent IPSPs were evoked in the on mode of stimulation while the off stimuli evoked both short latency feedforward IPSPs and a later recurrent IPSP component (arrows in trace 3). The fast rise time of the feedforward IPSPs is smeared by the averaging process. Note that the recurrent IPSP is replaced by a depolarising (disinhibitory) potential with the largest spot of stimulation (6). The late hyperpolarisation in the on trace was due to feedforward IPSPs paired with EPSPs from surround activation of the input retinal ganglion cell. Same cell as in Fig. 8
Fig. 11
Fig. 11
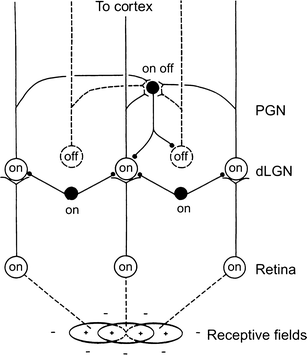
Schematic diagram of feedforward and recurrent inhibitory circuits of an on-centre principal cell in the dLGN. Open and filled circles represent excitatory and inhibitory cells, respectively. See text for further details

Similar articles

Cited by

References

    1. Acuna-Goycolea C, Brenowitz SD, Regehr WG. Active dendritic conductances dynamically regulate GABA release from thalamic interneurons. Neuron. 2008;57:420–431. doi: 10.1016/j.neuron.2007.12.022. - DOI - PubMed
    1. Ahlsén G. Brain stem neurons with differential projection to functional subregions of the dorsal lateral geniculate complex in the cat. Neuroscience. 1984;12:817–838. doi: 10.1016/0306-4522(84)90173-8. - DOI - PubMed
    1. Ahlsén G, Lindström S. Excitation of perigeniculate neurons via axon collaterals of principal cells. Brain Res. 1982;236:477–481. doi: 10.1016/0006-8993(82)90730-2. - DOI - PubMed
    1. Ahlsén G, Lindström S, Lo F-S. Excitation of perigeniculate neurones from X and Y principal cells in the lateral geniculate nucleus of the cat. Acta Physiol Scand. 1983;118:445–448. doi: 10.1111/j.1748-1716.1983.tb07296.x. - DOI - PubMed
    1. Ahlsén G, Lindström S, Lo F-S. Inhibition from the brain stem of inhibitory interneurones of the cat’s dorsal lateral geniculate nucleus. J Physiol. 1984;347:593–609. - PMC - PubMed

Publication types

MeSH terms

LinkOut - more resources