. 2011 Aug;13(4):733-50.
doi: 10.1007/s10126-010-9335-6. Epub 2010 Dec 3.

Development and experimental validation of a 20K Atlantic cod (Gadus morhua) oligonucleotide microarray based on a collection of over 150,000 ESTs

Affiliations

Development and experimental validation of a 20K Atlantic cod (Gadus morhua) oligonucleotide microarray based on a collection of over 150,000 ESTs

Marije Booman et al. Mar Biotechnol (NY). 2011 Aug.

Abstract

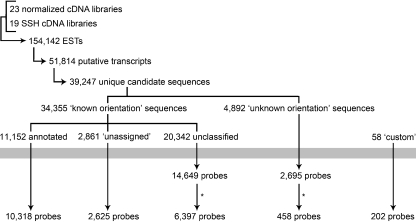
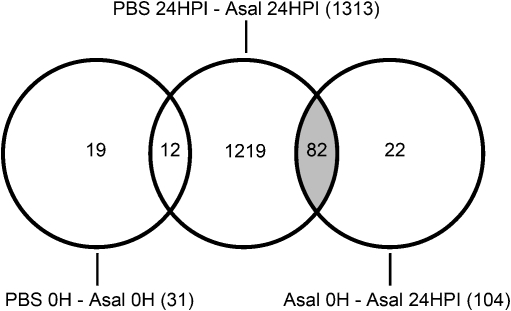
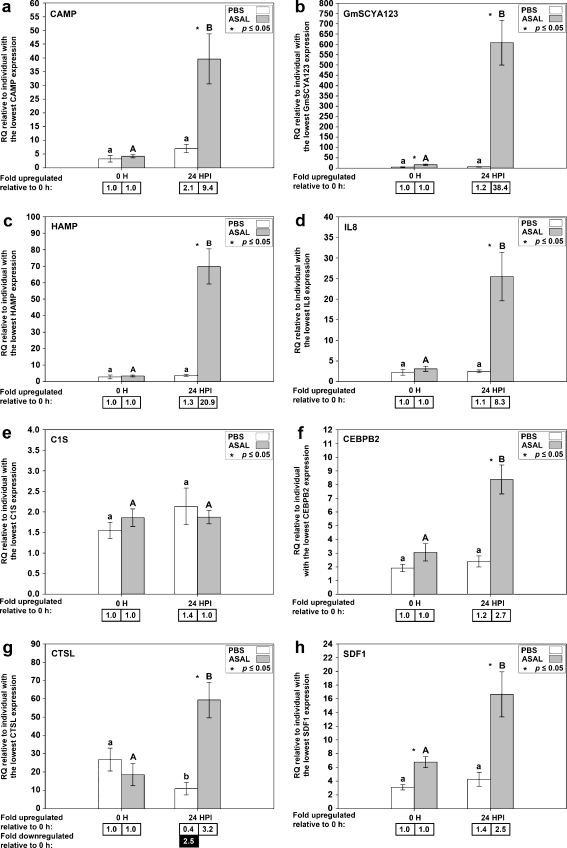
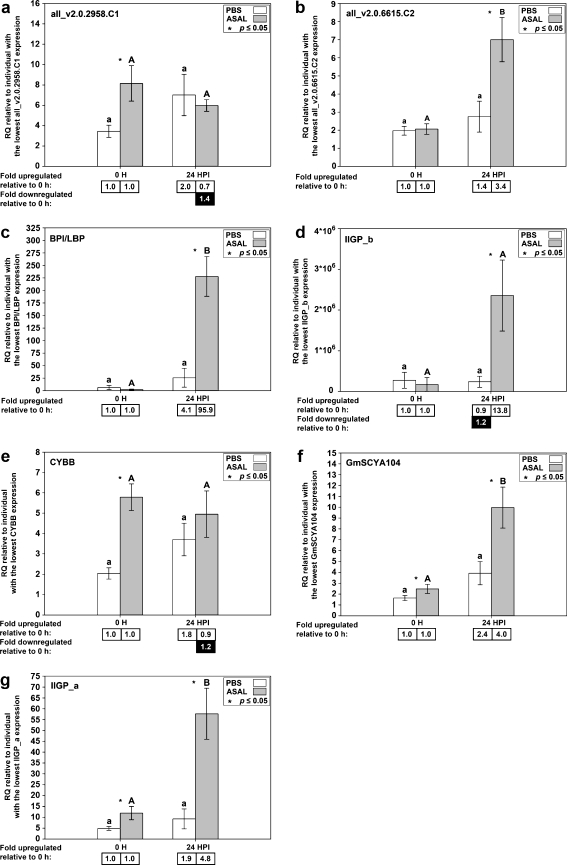
The collapse of Atlantic cod (Gadus morhua) wild populations strongly impacted the Atlantic cod fishery and led to the development of cod aquaculture. In order to improve aquaculture and broodstock quality, we need to gain knowledge of genes and pathways involved in Atlantic cod responses to pathogens and other stressors. The Atlantic Cod Genomics and Broodstock Development Project has generated over 150,000 expressed sequence tags from 42 cDNA libraries representing various tissues, developmental stages, and stimuli. We used this resource to develop an Atlantic cod oligonucleotide microarray containing 20,000 unique probes. Selection of sequences from the full range of cDNA libraries enables application of the microarray for a broad spectrum of Atlantic cod functional genomics studies. We included sequences that were highly abundant in suppression subtractive hybridization (SSH) libraries, which were enriched for transcripts responsive to pathogens or other stressors. These sequences represent genes that potentially play an important role in stress and/or immune responses, making the microarray particularly useful for studies of Atlantic cod gene expression responses to immune stimuli and other stressors. To demonstrate its value, we used the microarray to analyze the Atlantic cod spleen response to stimulation with formalin-killed, atypical Aeromonas salmonicida, resulting in a gene expression profile that indicates a strong innate immune response. These results were further validated by quantitative PCR analysis and comparison to results from previous analysis of an SSH library. This study shows that the Atlantic cod 20K oligonucleotide microarray is a valuable new tool for Atlantic cod functional genomics research.


Figures

Fig. 1
Fig. 1
Sequence selection and probe design. Flowchart of the procedure of selection of representative candidate sequences and probe design. In this flowchart, arrowheads indicate a reduction in the number of sequences. The gray bar indicates the probe design process. Asterisks indicate an additional probe selection procedure based on the number of ESTs contributing to each contig sequence (for probes from “unclassified” sequences) or on the abundance in SSH libraries and predicted roles in immune and stress responses (for probes from “unknown orientation” sequences). For more details on the probe design process, see “Materials and Methods” and ESM Fig. S1
Fig. 2
Fig. 2
Overview of informative probe lists and their intersections. This figure shows how the final list of 82 probes responsive to Asal was constructed (gray area). The 12 probes that were responsive to variability between tanks (from the comparison of PBS 0 h and Asal 0 h, left) were removed from the list of probes resulting from the comparison of PBS 24 HPI with Asal 24 HPI (middle) so that only probes responsive to Asal remained. Then, the final probe list was constructed by taking only the 82 probes that were responsive to Asal in both the comparisons of Asal 0 h with Asal 24 HPI (right) and of PBS 24 HPI with Asal 24 HPI (middle)
Fig. 3
Fig. 3
Hierarchical clustering of 82 probes that are responsive to stimulation with formalin-killed, atypical A. salmonicida. Sample groups are indicated at the top. Asal 24 HPI (red); Asal 0 h (green); PBS 0 h (blue); PBS 24 HPI (yellow). Two outlier individuals are indicated with an asterisk. Probe ID and description are indicated on the right side. Two gene clusters have been highlighted (see “Discussion”): antimicrobial genes (blue); CC chemokines (orange). A larger version of this image is available as ESM Fig. S5
Fig. 4
Fig. 4
QPCR results for genes identified as Asal-responsive by microarray and SSH. Average relative quantity (RQ) values with SEM error bars. Gene expression differences were determined by t tests on RQ values with a p value cutoff of 0.05. Statistically significant differences between treatments within time points are indicated with an asterisk. Statistically significant differences between time points within treatments are indicated with letters (lowercase for PBS, uppercase for A. salmonicida; different letters indicate significant difference). Fold upregulation was calculated as (average RQ 24 HPI)/(average RQ 0 h) for both PBS and Asal groups. Fold downregulation was calculated as 1/(fold upregulation). CAMP, GmSCYA123, HAMP, and IL8 were analyzed previously by QPCR using the same spleen samples but with a different QPCR instrument and using technical duplicates instead of technical triplicates (Feng et al. 2009). QPCR for these genes was repeated for the current study to ensure that all genes were analyzed using the same instrument and protocol
Fig. 5
Fig. 5
QPCR results for genes identified as Asal-responsive by microarray only. Average relative quantity (RQ) values with SEM error bars. Gene expression differences were determined by t tests on RQ values with a p value cutoff of 0.05. Statistically significant differences between treatments within time points are indicated with an asterisk. Statistically significant differences between time points within treatments are indicated with letters (lowercase for PBS, uppercase for A. salmonicida; different letters indicate significant difference). Fold upregulation was calculated as (average RQ 24 HPI)/(average RQ 0 h) for both PBS and Asal groups. Fold downregulation was calculated as 1/(fold upregulation)

References

    1. Benson G. Tandem repeats finder: a program to analyze DNA sequences. Nucleic Acids Res. 1999;27:573–580. doi: 10.1093/nar/27.2.573. - DOI - PMC - PubMed
    1. Borza T, Stone C, Gamperl AK, Bowman S. Atlantic cod (Gadus morhua) hemoglobin genes: multiplicity and polymorphism. BMC Genet. 2009;10:51. doi: 10.1186/1471-2156-10-51. - DOI - PMC - PubMed
    1. Borza T, Stone C, Rise ML, Bowman S, Johnson SC. Atlantic cod (Gadus morhua) CC chemokines: diversity and expression analysis. Dev Comp Immunol. 2010;34:904–913. doi: 10.1016/j.dci.2010.03.011. - DOI - PubMed
    1. Bowman S, Hubert S, Higgins B, Stone C, Kimball J, Borza T, Bussey JT, Simpson G, Kozera C, Curtis BA, Hall JR, Hori TS, Feng CY, Rise M, Booman M, Gamperl AK, Trippel E, Symonds J, Johnson SC, Rise ML (2010) An integrated approach to gene discovery and marker development in Atlantic cod (Gadus morhua). Mar Biotechnol (NY). doi:10.1007/s10126-010-9285-z - PMC - PubMed
    1. Bø TH, Dysvik B, Jonassen I. LSimpute: accurate estimation of missing values in microarray data with least squares methods. Nucleic Acids Research. 2004;32:e34. doi: 10.1093/nar/gnh026. - DOI - PMC - PubMed

Publication types