Mechanism-based disease progression modeling of type 2 diabetes in Goto-Kakizaki rats
- PMID: 21127951
- PMCID: PMC3727409
- DOI: 10.1007/s10928-010-9182-0
Mechanism-based disease progression modeling of type 2 diabetes in Goto-Kakizaki rats
Abstract
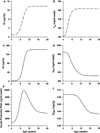
The dynamics of aging and type 2 diabetes (T2D) disease progression were investigated in normal [Wistar-Kyoto (WKY)] and diabetic [Goto-Kakizaki (GK)] rats and a mechanistic disease progression model was developed for glucose, insulin, and glycosylated hemoglobin (HbA1c) changes over time. The study included 30 WKY and 30 GK rats. Plasma glucose and insulin, blood glucose and HbA1c concentrations and hematological measurements were taken at ages 4, 8, 12, 16 and 20 weeks. A mathematical model described the development of insulin resistance (IR) and β-cell function with age/growth and diabetes progression. The model utilized transit compartments and an indirect response model to quantitate biomarker changes over time. Glucose, insulin and HbA1c concentrations in WKY rats increased to a steady-state at 8 weeks due to developmental changes. Glucose concentrations at 4 weeks in GK rats were almost twice those of controls, and increased to a steady-state after 8 weeks. Insulin concentrations at 4 weeks in GK rats were similar to controls, and then hyperinsulinemia occurred until 12-16 weeks of age indicating IR. Subsequently, insulin concentrations in GK rats declined to slightly below WKY controls due to β-cell failure. HbA1c showed a delayed increase relative to glucose. Modeling of HbA1c was complicated by age-related changes in hematology in rats. The diabetes model quantitatively described the glucose/insulin inter-regulation and HbA1c production and reflected the underlying pathogenic factors of T2D--IR and β-cell dysfunction. The model could be extended to incorporate other biomarkers and effects of various anti-diabetic drugs.
Figures


Similar articles
-
Modeling diabetes disease progression and salsalate intervention in Goto-Kakizaki rats.J Pharmacol Exp Ther. 2011 Dec;339(3):896-904. doi: 10.1124/jpet.111.185686. Epub 2011 Sep 8. J Pharmacol Exp Ther. 2011. PMID: 21903749 Free PMC article.
-
Gene expression analysis of hepatic roles in cause and development of diabetes in Goto-Kakizaki rats.J Endocrinol. 2009 Mar;200(3):331-46. doi: 10.1677/JOE-08-0404. Epub 2008 Dec 12. J Endocrinol. 2009. PMID: 19074471
-
Modeling disease progression and rosiglitazone intervention in type 2 diabetic Goto-Kakizaki rats.J Pharmacol Exp Ther. 2012 Jun;341(3):617-25. doi: 10.1124/jpet.112.192419. Epub 2012 Feb 29. J Pharmacol Exp Ther. 2012. PMID: 22378938 Free PMC article.
-
Lupinus mutabilis Extract Exerts an Anti-Diabetic Effect by Improving Insulin Release in Type 2 Diabetic Goto-Kakizaki Rats.Nutrients. 2018 Jul 20;10(7):933. doi: 10.3390/nu10070933. Nutrients. 2018. PMID: 30037028 Free PMC article.
-
Selectively bred rodent models for studying the etiology of type 2 diabetes: Goto-Kakizaki rats and Oikawa-Nagao mice.Endocr J. 2023 Jan 30;70(1):19-30. doi: 10.1507/endocrj.EJ22-0253. Epub 2022 Dec 7. Endocr J. 2023. PMID: 36477370 Review.
Cited by
-
Modeling Disease Progression: Angiotensin II Indirectly Inhibits Nitric Oxide Production via ADMA Accumulation in Spontaneously Hypertensive Rats.Front Physiol. 2016 Nov 17;7:555. doi: 10.3389/fphys.2016.00555. eCollection 2016. Front Physiol. 2016. PMID: 27909412 Free PMC article.
-
Modeling diabetes disease progression and salsalate intervention in Goto-Kakizaki rats.J Pharmacol Exp Ther. 2011 Dec;339(3):896-904. doi: 10.1124/jpet.111.185686. Epub 2011 Sep 8. J Pharmacol Exp Ther. 2011. PMID: 21903749 Free PMC article.
-
Population pharmacodynamic modeling of exenatide after 2-week treatment in STZ/NA diabetic rats.J Pharm Sci. 2013 Oct;102(10):3844-51. doi: 10.1002/jps.23682. Epub 2013 Jul 29. J Pharm Sci. 2013. PMID: 23897494 Free PMC article.
-
Multimodal Highlighting of Structural Abnormalities in Diabetic Rat and Human Corneas.Transl Vis Sci Technol. 2013 Feb;2(2):3. doi: 10.1167/tvst.2.2.3. Epub 2013 Mar 4. Transl Vis Sci Technol. 2013. PMID: 24049714 Free PMC article.
-
ROK and Arteriolar Myogenic Tone Generation: Molecular Evidence in Health and Disease.Front Pharmacol. 2017 Feb 23;8:87. doi: 10.3389/fphar.2017.00087. eCollection 2017. Front Pharmacol. 2017. PMID: 28280468 Free PMC article. Review.
References
-
- CDC. Atlanta: CDC; 2007. US Centers for Disease Control and Prevention (CDC): national diabetes fact sheet.
-
- Saltiel AR, Kahn CR. Insulin signalling and the regulation of glucose and lipid metabolism. Nature. 2001;414:799–806. - PubMed
-
- LeRoith D. Beta-cell dysfunction and insulin resistance in type 2 diabetes: role of metabolic and genetic abnormalities. Am J Med. 2002;113(Suppl 6A):3S–11S. - PubMed
-
- Chan PL, Holford NH. Drug treatment effects on disease progression. Annu Rev Pharmacol Toxicol. 2001;41:625–659. - PubMed
-
- Portha B. Programmed disorders of beta-cell development and function as one cause for type 2 diabetes? The GK rat paradigm. Diabetes Metab Res Rev. 2005;21:495–504. - PubMed
Publication types
MeSH terms
Substances
Grants and funding
LinkOut - more resources
Full Text Sources
Medical

