. 2010 Dec 29;132(51):18103-14.
doi: 10.1021/ja104924b. Epub 2010 Dec 3.

Gold nano-popcorn-based targeted diagnosis, nanotherapy treatment, and in situ monitoring of photothermal therapy response of prostate cancer cells using surface-enhanced Raman spectroscopy

Affiliations

Gold nano-popcorn-based targeted diagnosis, nanotherapy treatment, and in situ monitoring of photothermal therapy response of prostate cancer cells using surface-enhanced Raman spectroscopy

Wentong Lu et al. J Am Chem Soc. .

Abstract

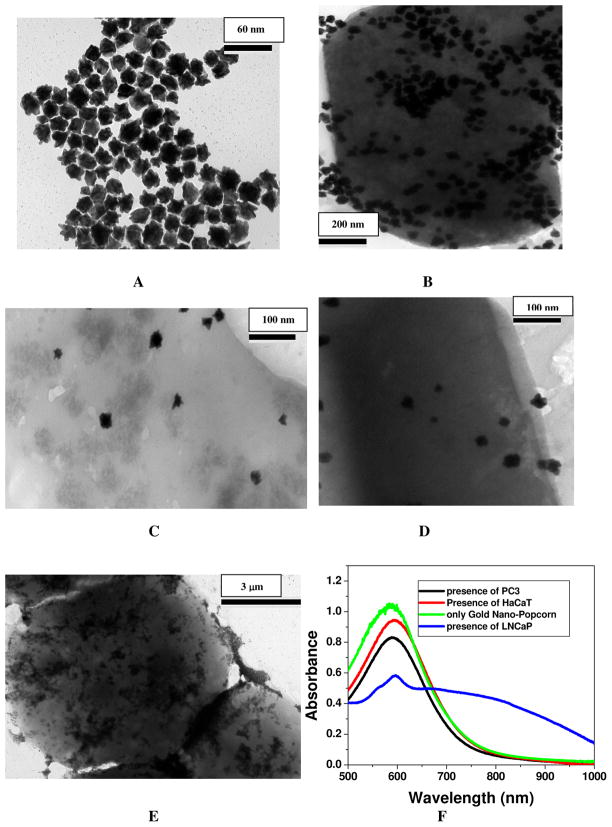
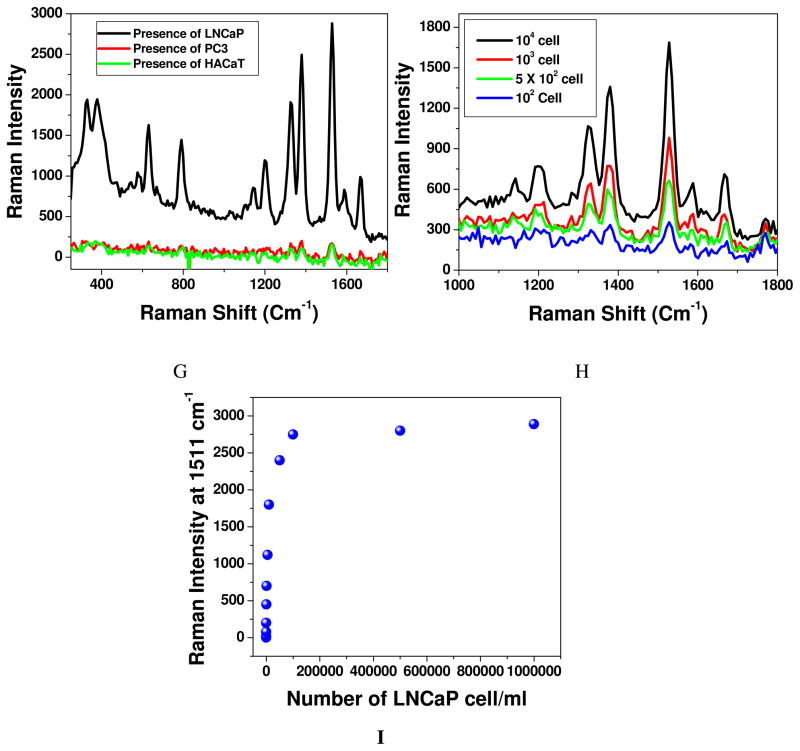
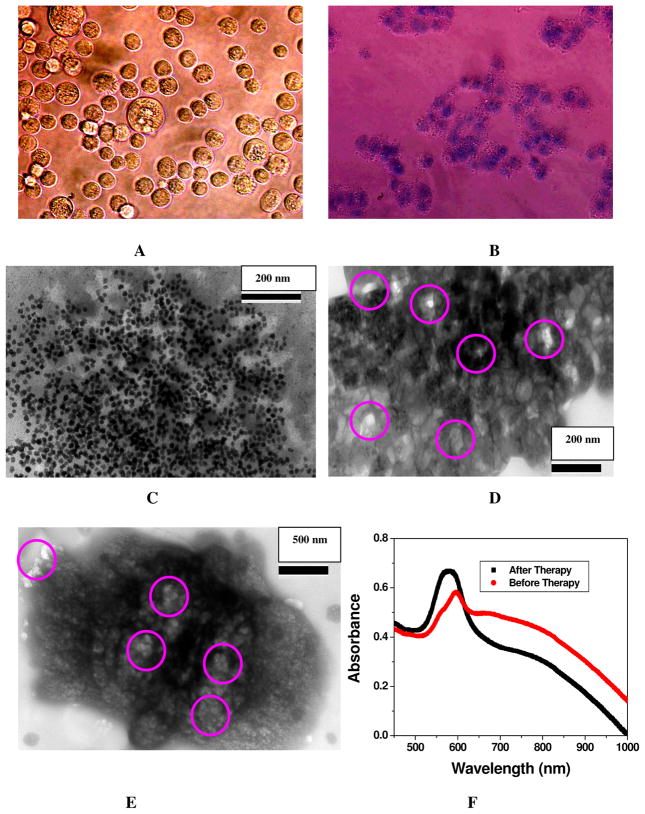
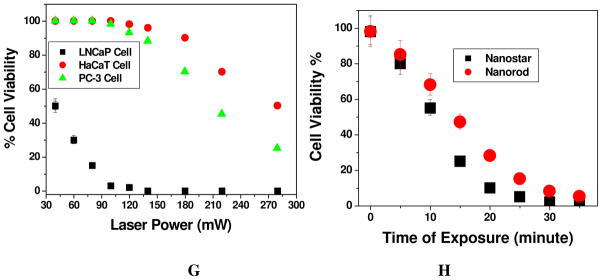
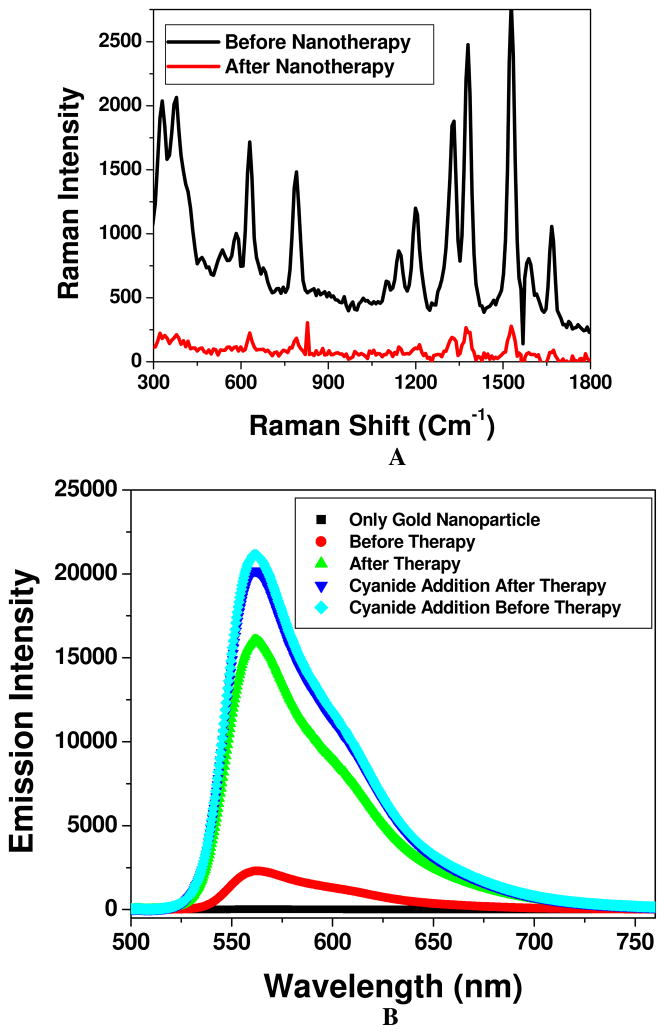
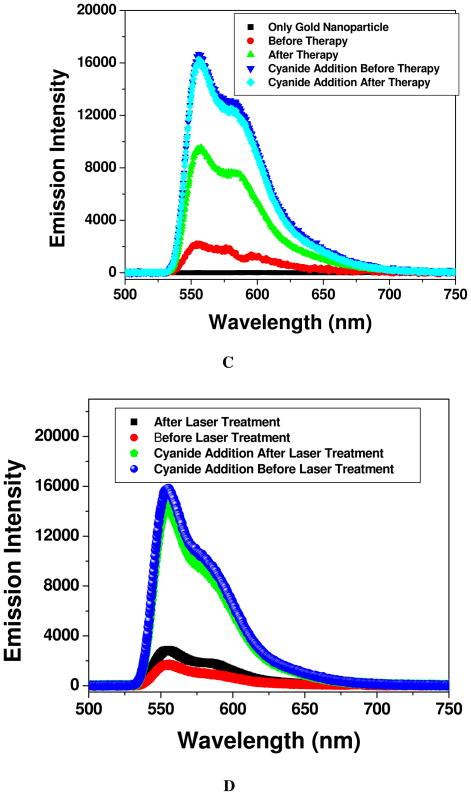
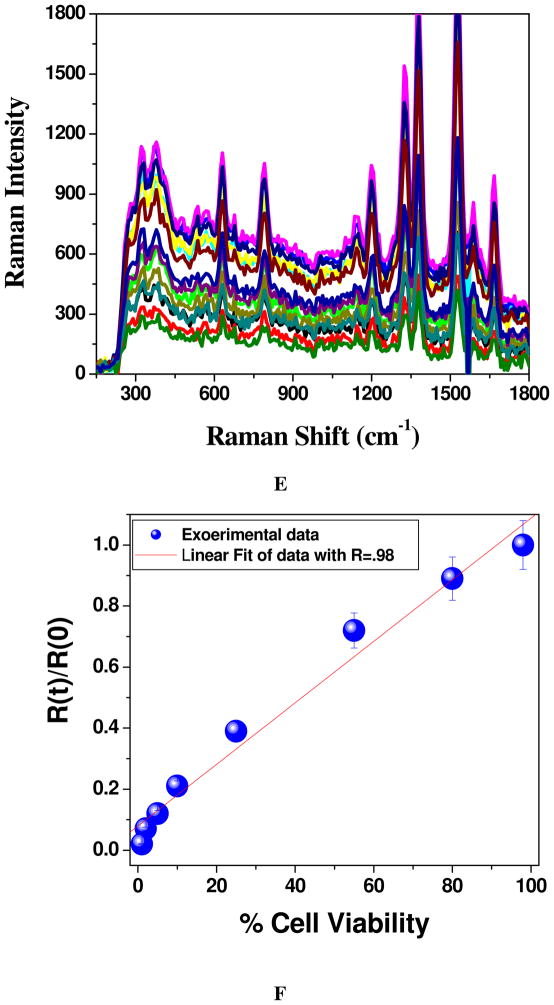
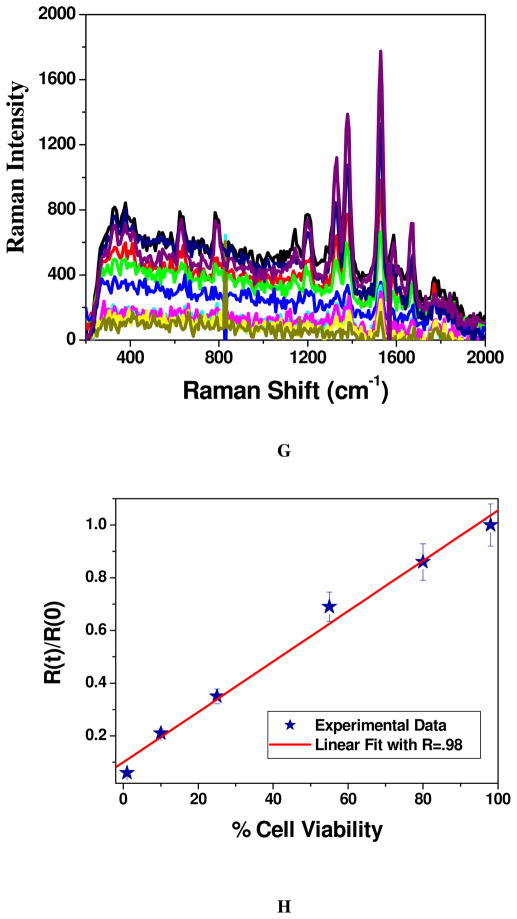
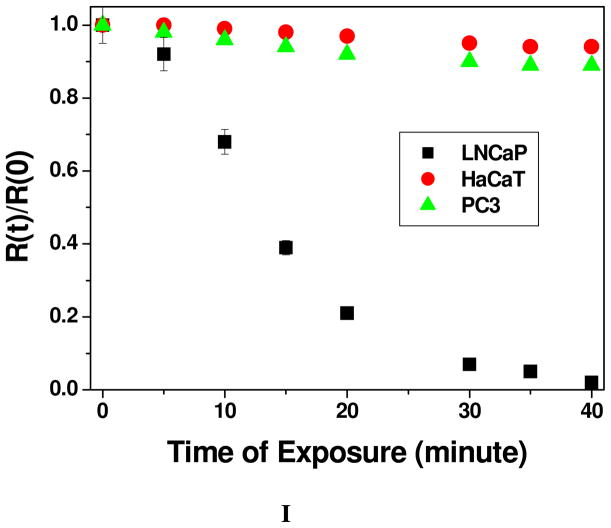
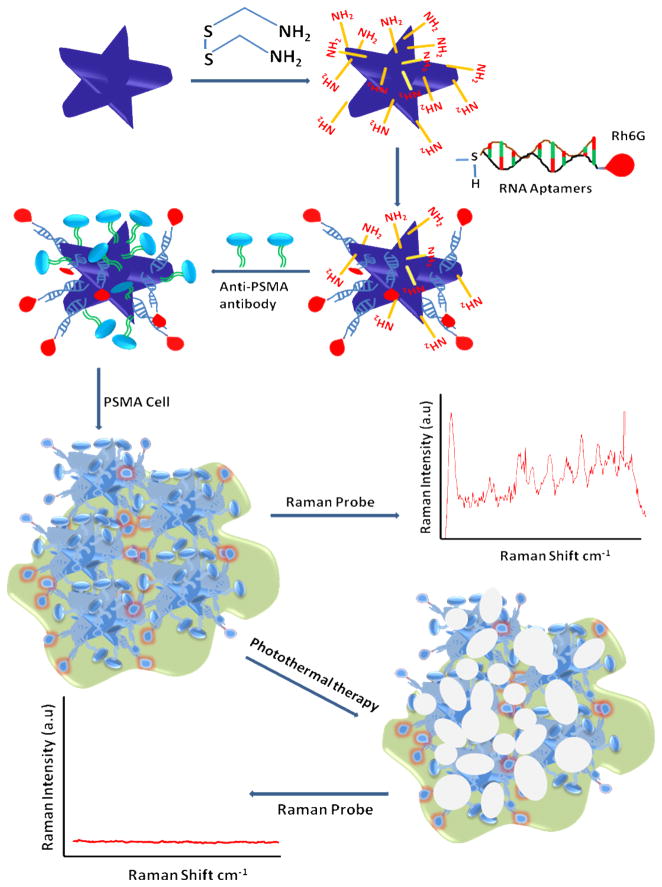
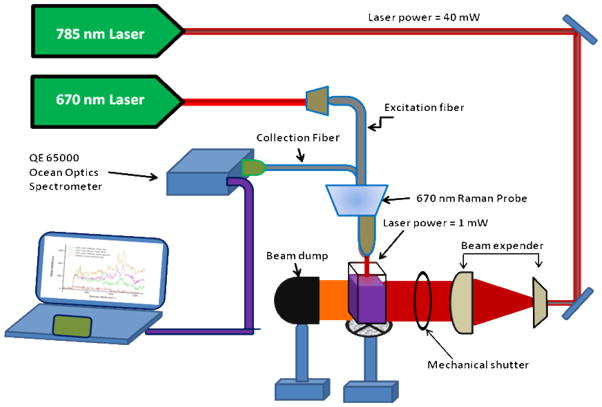
Prostate cancer is the second leading cause of cancer-related death among the American male population, and the cost of treating prostate cancer patients is about $10 billion/year in the United States. Current treatments are mostly ineffective against advanced-stage prostate cancer and are often associated with severe side effects. Driven by these factors, we report a multifunctional, nanotechnology-driven, gold nano-popcorn-based surface-enhanced Raman scattering (SERS) assay for targeted sensing, nanotherapy treatment, and in situ monitoring of photothermal nanotherapy response during the therapy process. Our experimental data show that, in the presence of LNCaP human prostate cancer cells, multifunctional popcorn-shaped gold nanoparticles form several hot spots and provide a significant enhancement of the Raman signal intensity by several orders of magnitude (2.5 × 10(9)). As a result, it can recognize human prostate cancer cells at the 50-cells level. Our results indicate that the localized heating that occurs during near-infrared irradiation can cause irreparable cellular damage to the prostate cancer cells. Our in situ time-dependent results demonstrate for the first time that, by monitoring SERS intensity changes, one can monitor photothermal nanotherapy response during the therapy process. Possible mechanisms and operating principles of our SERS assay are discussed. Ultimately, this nanotechnology-driven assay could have enormous potential applications in rapid, on-site targeted sensing, nanotherapy treatment, and monitoring of the nanotherapy process, which are critical to providing effective treatment of cancer.


Figures

Figure 1
Figure 1
A) TEM image showing anti PSMA antibody and A9 RNA aptamer conjugated popcorn shape gold nanoparticles before the addition of cancer cell line. B) TEM image demonstrating aggregation of multifunctional popcorn shape gold nanoparticles after the addition of 104 human prostate cancer LNCaP cells/mL for 30 minutes. C) TEM image demonstrating about no aggregation after the addition of 105 HaCaT cells/ml on multifunctional popcorn shape gold nanoparticles for 4 hours, where nanoparticles are randomly distributed on the whole cells. D) TEM image showing very little or about no aggregation after the addition of 105 PSMA negative human prostate cancerous PC-3 cells/ml on multifunctional popcorn shape gold nanoparticles for 4 hours. E) TEM image shows the formation of cancer cell clusters in presence of 106 human prostate cancer LNCaP cells/ml. F) Absorption profile showing variation of multifunctional popcorn shape gold nanoparticles due to the addition of different cancerous and non-cancerous cells. The strong long wavelength band in the visible region (λPR = 580 nm) is due to the oscillation of the conduction band electrons. New band appearing around 780 nm, due to the addition of LNCaP cell, demonstrates the aggregation of gold nanoparticles. It has also been demonstrated that the HaCaT noncancerous cells and PSMA negative human prostate cancerous PC-3 cells are poorly labeled by the nanoparticles and as a result, we have not observed any new broad band corresponding to nano-aggregates G) Plot demonstrating SERS enhancement and selectivity of our multifunctional popcorn shape gold nanoparticles based SERS assay. Raman intensity enhances 2.5 × 10⁹ times upon the addition of 4.8 × 10⁴ LNCaP cells/ml human prostate cancerous cells. Whereas Raman scattering intensity remains unchanged upon the addition of 106 PC-3 cells/ml, PSMA negative human prostate cancerous cells and 106 HaCaT cells/ml, human skin nan-cancerous cells. H) Plot demonstrating SERS scattering intensity changes upon the addition of different concentrations (number of cells/ml) of LNCaP human prostate cancerous cells to multifunctional popcorn shape gold nanoparticle. I) Plot demonstrating how Raman intensity at 1511 cm−1 changes upon the addition of different concentration (cell/ml) of LNCaP prostate cancer cell.
Figure 1
Figure 1
A) TEM image showing anti PSMA antibody and A9 RNA aptamer conjugated popcorn shape gold nanoparticles before the addition of cancer cell line. B) TEM image demonstrating aggregation of multifunctional popcorn shape gold nanoparticles after the addition of 104 human prostate cancer LNCaP cells/mL for 30 minutes. C) TEM image demonstrating about no aggregation after the addition of 105 HaCaT cells/ml on multifunctional popcorn shape gold nanoparticles for 4 hours, where nanoparticles are randomly distributed on the whole cells. D) TEM image showing very little or about no aggregation after the addition of 105 PSMA negative human prostate cancerous PC-3 cells/ml on multifunctional popcorn shape gold nanoparticles for 4 hours. E) TEM image shows the formation of cancer cell clusters in presence of 106 human prostate cancer LNCaP cells/ml. F) Absorption profile showing variation of multifunctional popcorn shape gold nanoparticles due to the addition of different cancerous and non-cancerous cells. The strong long wavelength band in the visible region (λPR = 580 nm) is due to the oscillation of the conduction band electrons. New band appearing around 780 nm, due to the addition of LNCaP cell, demonstrates the aggregation of gold nanoparticles. It has also been demonstrated that the HaCaT noncancerous cells and PSMA negative human prostate cancerous PC-3 cells are poorly labeled by the nanoparticles and as a result, we have not observed any new broad band corresponding to nano-aggregates G) Plot demonstrating SERS enhancement and selectivity of our multifunctional popcorn shape gold nanoparticles based SERS assay. Raman intensity enhances 2.5 × 10⁹ times upon the addition of 4.8 × 10⁴ LNCaP cells/ml human prostate cancerous cells. Whereas Raman scattering intensity remains unchanged upon the addition of 106 PC-3 cells/ml, PSMA negative human prostate cancerous cells and 106 HaCaT cells/ml, human skin nan-cancerous cells. H) Plot demonstrating SERS scattering intensity changes upon the addition of different concentrations (number of cells/ml) of LNCaP human prostate cancerous cells to multifunctional popcorn shape gold nanoparticle. I) Plot demonstrating how Raman intensity at 1511 cm−1 changes upon the addition of different concentration (cell/ml) of LNCaP prostate cancer cell.
Figure 2
Figure 2
A,B) Bright field inverted microscope images of multifunctional popcorn shape gold nanoparticle conjugated LNCaP prostate cancer cells, A) Before therapy, B) After therapy for 30 minutes and after stained with Trypan Blue. C) TEM image showing deformation of nano-popcorn structure after popcorn shape gold nanoparticle conjugated LNCaP cells were exposed to 100 mW, 785 nm NIR continuous-wave radiation for 10 minutes, D) TEM image showing structure deformation and irreparable damage of cancer cell surfaces after 20 minutes radiation, purple circles are showing bubble formation. E) TEM image demonstrating irreparable damage of cancer cell surfaces when multifunctional popcorn shape gold nanoparticle conjugated LNCaP cells were exposed to 100 mW, 785 nm NIR continuous-wave radiation for 30 minutes, purple circles are showing bubble formation. F) Absorption profile demonstrating nanoparticle structural change after nano-therapy process. G) Plot showing cell viability measured by MTT test after popcorn shape gold nanoparticle conjugated LNCaP cells, PC-3 and HaCaT cells were exposed to 785 nm NIR continuous-wave radiation at different power dose. H) Plot demonstrated a comparison on photothermal therapy response between well characterized gold nanorod and popcorn shape gold nanoparticle, when multifunctional nanoparticle conjugated LNCaP cells are exposed to 100 mW 785 nm NIR continuous-wave radiation for different times.
Figure 2
Figure 2
A,B) Bright field inverted microscope images of multifunctional popcorn shape gold nanoparticle conjugated LNCaP prostate cancer cells, A) Before therapy, B) After therapy for 30 minutes and after stained with Trypan Blue. C) TEM image showing deformation of nano-popcorn structure after popcorn shape gold nanoparticle conjugated LNCaP cells were exposed to 100 mW, 785 nm NIR continuous-wave radiation for 10 minutes, D) TEM image showing structure deformation and irreparable damage of cancer cell surfaces after 20 minutes radiation, purple circles are showing bubble formation. E) TEM image demonstrating irreparable damage of cancer cell surfaces when multifunctional popcorn shape gold nanoparticle conjugated LNCaP cells were exposed to 100 mW, 785 nm NIR continuous-wave radiation for 30 minutes, purple circles are showing bubble formation. F) Absorption profile demonstrating nanoparticle structural change after nano-therapy process. G) Plot showing cell viability measured by MTT test after popcorn shape gold nanoparticle conjugated LNCaP cells, PC-3 and HaCaT cells were exposed to 785 nm NIR continuous-wave radiation at different power dose. H) Plot demonstrated a comparison on photothermal therapy response between well characterized gold nanorod and popcorn shape gold nanoparticle, when multifunctional nanoparticle conjugated LNCaP cells are exposed to 100 mW 785 nm NIR continuous-wave radiation for different times.
Figure 3
Figure 3
A) Demonstrating surface-enhanced Raman spectral change from Rh-6G modified A9 aptamer and anti-PSMA antibody coated popcorn shape gold nanoparticles conjugated LNCaP cells, before and after nanotherapy. B) NSET intensity change before and after photothermal therapy, when Cy3 modified A9 aptamer and anti-PSMA antibody coated popcorn shape gold nanoparticle conjugated LNCaP cell was exposed to 100 mW, 785 nm NIR continuous-wave radiation for 30 minutes. Plot also demonstrates how NSET intensity changes due to the addition of cyanide in both cases before and after therapy, which destroys the gold nanostructure completely. Similarly plot also shows that when only Cy3 dye (100 nM) was adsorbed on gold nanoparticle, fluorescence signal was quenched about 100%. C) NSET intensity change before and after photothermal therapy, when Cy3 modified anti-PSMA antibody and A9 aptamer coated popcorn shape gold nanoparticle conjugated LNCaP cell was exposed to 100 mW, 785 nm NIR continuous-wave radiation for 30 minutes. Plot also demonstrates how NSET intensity changes due to the addition of cyanide in both cases before and after therapy, which destroys the gold nanostructure completely. Similarly, plot also shows that when only Cy3 dye (100 nM) was adsorbed onto gold nanoparticle, fluorescence signal was quenched almost by 100%. D) NSET intensity change before and after laser treatment, when Cy3 modified A9 aptamer and anti-PSMA antibody coated popcorn shape gold nanoparticle was exposed to 100 mW, 785 nm NIR continuous-wave radiation for 30 minutes. Plot also demonstrates how NSET intensity changes due to the addition of cyanide ion both cases before and after laser treatment, which destroys the gold nanostructure completely. E) Plot demonstrating time dependent SERS intensity decrease during nanotherapy progress of LNCaP prostate cancer cell. SERS intensity measurements have been performed at every two minutes interval during therapy process for 30 minutes. F) Plot showing linear relationship between % of LNCaP cell viability and SERS intensity change, when multifunctional popcorn shape gold nanoparticle conjugated LNCaP cells were exposed to 100 mW, 785 nm NIR continuous-wave radiation for 30 minutes. G) Plot demonstrating time-dependent SERS intensity decrease during nanotherapy progress for SK-BR-3 breast cancer cell line, when monoclonal anti-HER2/c-erb-2 antibody and Cy3 modified S6 aptamer conjugated popcorn shape gold nanoparticle are attached on SK-BR-3 cell line. SERS intensity measurements have been performed at every two minutes interval during therapy process for 30 minutes. H) Plot showing linear relationship between % of SK-BR-3 cell viability and SERS intensity change, when multifunctional popcorn shape gold nanoparticle conjugated SK-BR-3 cells were exposed to 100 mW, 785 nm NIR continuous-wave radiation for 30 minutes. I) Plot demonstrating SERS intensity change when multifunctional popcorn shape gold nanoparticle conjugated LNCaP, PC-3 and HaCaT cells were exposed to different power 785 nm NIR continuous-wave radiation for 30 minutes.
Figure 3
Figure 3
A) Demonstrating surface-enhanced Raman spectral change from Rh-6G modified A9 aptamer and anti-PSMA antibody coated popcorn shape gold nanoparticles conjugated LNCaP cells, before and after nanotherapy. B) NSET intensity change before and after photothermal therapy, when Cy3 modified A9 aptamer and anti-PSMA antibody coated popcorn shape gold nanoparticle conjugated LNCaP cell was exposed to 100 mW, 785 nm NIR continuous-wave radiation for 30 minutes. Plot also demonstrates how NSET intensity changes due to the addition of cyanide in both cases before and after therapy, which destroys the gold nanostructure completely. Similarly plot also shows that when only Cy3 dye (100 nM) was adsorbed on gold nanoparticle, fluorescence signal was quenched about 100%. C) NSET intensity change before and after photothermal therapy, when Cy3 modified anti-PSMA antibody and A9 aptamer coated popcorn shape gold nanoparticle conjugated LNCaP cell was exposed to 100 mW, 785 nm NIR continuous-wave radiation for 30 minutes. Plot also demonstrates how NSET intensity changes due to the addition of cyanide in both cases before and after therapy, which destroys the gold nanostructure completely. Similarly, plot also shows that when only Cy3 dye (100 nM) was adsorbed onto gold nanoparticle, fluorescence signal was quenched almost by 100%. D) NSET intensity change before and after laser treatment, when Cy3 modified A9 aptamer and anti-PSMA antibody coated popcorn shape gold nanoparticle was exposed to 100 mW, 785 nm NIR continuous-wave radiation for 30 minutes. Plot also demonstrates how NSET intensity changes due to the addition of cyanide ion both cases before and after laser treatment, which destroys the gold nanostructure completely. E) Plot demonstrating time dependent SERS intensity decrease during nanotherapy progress of LNCaP prostate cancer cell. SERS intensity measurements have been performed at every two minutes interval during therapy process for 30 minutes. F) Plot showing linear relationship between % of LNCaP cell viability and SERS intensity change, when multifunctional popcorn shape gold nanoparticle conjugated LNCaP cells were exposed to 100 mW, 785 nm NIR continuous-wave radiation for 30 minutes. G) Plot demonstrating time-dependent SERS intensity decrease during nanotherapy progress for SK-BR-3 breast cancer cell line, when monoclonal anti-HER2/c-erb-2 antibody and Cy3 modified S6 aptamer conjugated popcorn shape gold nanoparticle are attached on SK-BR-3 cell line. SERS intensity measurements have been performed at every two minutes interval during therapy process for 30 minutes. H) Plot showing linear relationship between % of SK-BR-3 cell viability and SERS intensity change, when multifunctional popcorn shape gold nanoparticle conjugated SK-BR-3 cells were exposed to 100 mW, 785 nm NIR continuous-wave radiation for 30 minutes. I) Plot demonstrating SERS intensity change when multifunctional popcorn shape gold nanoparticle conjugated LNCaP, PC-3 and HaCaT cells were exposed to different power 785 nm NIR continuous-wave radiation for 30 minutes.
Scheme 1
Scheme 1
Schematic representation shows the synthesis of monoclonal anti-PSMA antibody and A9 RNA aptamers-conjugated popcorn shape gold nanoparticles. Third step shows schematic representation of multifunctional popcorn shape gold nanoparticle based sensing of LNCaP breast cancer cell line.
Scheme 2
Scheme 2
Schematic presentation for time-resolved SERS set up we have used for in-situ measurement of SERS intensity during nanotherapy.

References

    1. Bray F, Møller B. Nature Reviews Cancer. 2006;6:63–74. - PubMed
    1. http://www.who.int/cancer/en

    1. http://www.cancer.org/docroot/cri/content/cri_2_4_1x_what_are_the_key_statistics_for_prostate_cancer_36.asp

    1. http://www.cdc.gov/cancer/prostate

    1. http://www.cdc.gov/cancer/dcpc/data/men.htm

Publication types