. 2010 Dec 3:11:590.
doi: 10.1186/1471-2105-11-590.

Merged consensus clustering to assess and improve class discovery with microarray data

Affiliations

Merged consensus clustering to assess and improve class discovery with microarray data

T Ian Simpson et al. BMC Bioinformatics. .

Abstract

Background: One of the most commonly performed tasks when analysing high throughput gene expression data is to use clustering methods to classify the data into groups. There are a large number of methods available to perform clustering, but it is often unclear which method is best suited to the data and how to quantify the quality of the classifications produced.

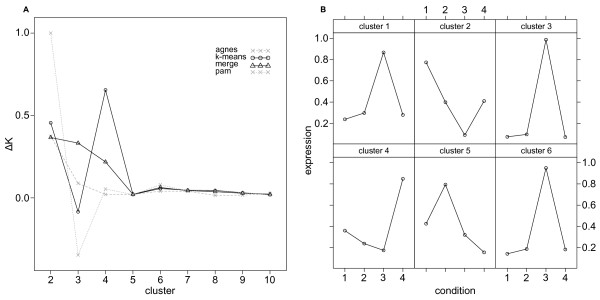
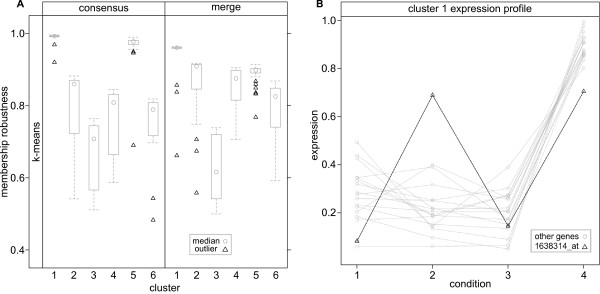
Results: Here we describe an R package containing methods to analyse the consistency of clustering results from any number of different clustering methods using resampling statistics. These methods allow the identification of the the best supported clusters and additionally rank cluster members by their fidelity within the cluster. These metrics allow us to compare the performance of different clustering algorithms under different experimental conditions and to select those that produce the most reliable clustering structures. We show the application of this method to simulated data, canonical gene expression experiments and our own novel analysis of genes involved in the specification of the peripheral nervous system in the fruitfly, Drosophila melanogaster.

Conclusions: Our package enables users to apply the merged consensus clustering methodology conveniently within the R programming environment, providing both analysis and graphical display functions for exploring clustering approaches. It extends the basic principle of consensus clustering by allowing the merging of results between different methods to provide an averaged clustering robustness. We show that this extension is useful in correcting for the tendency of clustering algorithms to treat outliers differently within datasets. The R package, clusterCons, is freely available at CRAN and sourceforge under the GNU public licence.


Figures

Figure 1
Figure 1
Calculating the consensus clustering result. The results of any discrete clustering algorithm can be represented as a membership list in which the features are indexed by cluster. (A) The clustering result can be readily converted into a connectivity matrix representing the co-clustering connections of the features. In a consensus clustering experiment the clustering process is performed many times with sub-samples of the data rows and the resulting partial connectivity matrices are summed. In addition, the frequency with which pairs of features are drawn together are counted and summed to produce an indicator matrix quantifying the opportunity any two members have to cluster together. (B) By dividing the connectivity and indicator matrices we produce the final consensus matrix which measures the frequency with which any two features cluster together.
Figure 2
Figure 2
Consensus clustering with simulated gene expression profile data. (A) Simulated gene expression sets were generated randomly from normal distributions centred around four characteristic profiles (1,0,1,1), (0,1,1,0), (1,1,0,0), (0,1,0,0) which were then spiked with expression profiles centred on (1,1,1,1), (0,0,1,1), (1,1,0,0) and (0.5,0.5,0,0). (B) Unsupervised clustering with agnes and pam was used to partition the expression data into four clusters. Only profiles 1 and 2 were successfully identified by agnes, profiles 3 and 4 were consolidated and the (0,0,1,1) spike data segregated into a new profile (top row). Conversely, pam identified four expression profiles and segregated spike data into the closest matching profiles (bottom row). (C) Clustering with agnes and pam was repeated using clusterCons and the membership robustness calculated for each profile ('consensus' panels). For agnes, the spike data in cluster 1 are revealed as outliers (open triangles) and the robustness for cluster 3 is noticeably lower than clusters 1-4 reflecting its heterogeneity. Clusters produced by pam showed high robustness with only the spike data in cluster 3, observable as outliers (open triangles). Merge consensus matrices were generated from these two consensus clustering results and cast onto the agnes and pam clustering structures ('merge' panels) producing a more balanced view of membership (and hence cluster) robustness. For agnes, as expected, profiles 1, 2 and 4 remain largely unaffected, but profile 3 is heavily penalised as it is inconsistent between clustering algorithms. All pam profiles retain their high membership robustness, but now spike data are revealed for all profiles as outliers. (D) The optimal cluster number was estimated by finding the largest change in area under the cumulative density curve (AUC) for the consensus matrix of each clustering experiment by cluster number. Using this approach, the merge consensus matrix correctly predicted an optimal cluster number of 4, whereas agnes predicted 5.
Figure 3
Figure 3
Patient class discovery using a consensus clustering approach. The leukaemia gene expression data set of Golub et al. [22] was used to assess the utility of consensus clustering to the segregation of patients into either an all (1-27) or aml (28-38) cluster. Consensus clustering was carried out with 500 iterations and the clustering algorithms agnes, k-means and pam and the membership robustness was calculated and plotted against patient number for both clusters. All three algorithms correctly segregated the aml patients into the same cluster ('consensus' panels, cluster 2, black filled circles), but only agnes (all) and k-means (all but 2 and 12) segregated the all patients reliably, whereas pam failed to correctly segregate 8/27 all patients. Merge consensus matrices were generated and membership robustness calculated for each of the three clustering structures ('merge' panels). Agnes and k-means produced almost identical results correctly segregating all patients apart from aml patients 2 and 12. Pam correctly segregated all aml patients, but could not segregate 19/27 all patients.
Figure 4
Figure 4
Leukaemia patient expression profiles. The expression profiles of all leukaemia patients were plotted against the gene identification number grouped by patient class ('all' and 'aml' panels) and the profiles of atypical all profiles for patients 2 (solid black line) and 12 (dashed black line) highlighted.
Figure 5
Figure 5
Discovering gene expression profiles with consensus clustering. A fruitfly PNS gene expression data set (TIS, APJ, data available from the gene expression omnibus (GEO) accession GSE21520) was used to test the ability of clusterCons to identify gene expression profiles across a developmental time-series. (A) Consensus clustering was performed with agnes, pam and k-means algorithms with 100 iterations and cluster numbers k = {2, 3...10}. The optimal cluster number was estimated by calculating first the AUC and then the delta-K values for the consensus and merge consensus matrices and a delta-K plot generated. The small, but consistent peak at k = 6 for k-means, pam and merge consensus matrices was select for further study using the k-means clustering structure. (B) Relative gene expression means were plotted for all probe-sets by cluster revealing discrete and stereotypical profiles describing stage and genotype specific features. Among these are profiles for early (clusters 2 and 4), mid (cluster 5) and late (clusters 1,3 and 6) expressed genes as well as differentiation of genes that are expressed lower (clusters 2 and 5) or higher (cluster 4) in the atonal mutant.
Figure 6
Figure 6
Refining gene expression profiles with merge consensus clustering. We compared the cluster and membership robustness of consensus and merge consensus clustering matrices using the k-means clustering structure. (A) For the consensus clustering results, clusters 1 and 5 were highly robust (cr = 0.99 and 0.97), clusters 2-4 and 6 were moderately robust (cr = 0.81, 0.66, 0.76 and 0.74) and outliers (open black triangles) were evident for clusters 1, 5 and 6. Refinement of the robustness measures by merge consensus clustering broadly maintained or improved the overall cluster robustness (cr = 0.93, 0.87, 0.63, 0.85, 0.90 and 0.79, clusters 1-6 respectively), but re-segregated the outliers for clusters 1,2,5 and 6. For example, a striking outlier appears for the highly conserved cluster 1 as a result of merge consensus clustering (probe-set 1638314-at, mr = 0.99 → 0.66). (B) This outlier is confirmed by plotting the relative gene expression for all of the probe-sets in cluster 1 (probe-set 1638314-at black line, open black triangles).

Similar articles

Cited by

References

    1. Gollub J, Sherlock G. Clustering Microarray Data. Methods in Enzymology. 2006;411:194–213. doi: 10.1016/S0076-6879(06)11010-1. - DOI - PubMed
    1. Kerr G, Ruskin HJ, Crane M, Doolan P. Techniques for clustering gene expression data. Computers in biology and medicine. 2008;38(3):283–293. doi: 10.1016/j.compbiomed.2007.11.001. - DOI - PubMed
    1. Do JHH, Choi DK. Clustering approaches to identifying gene expression patterns from DNA microarray data. Molecules and cells. 2008;25(2):279–288. - PubMed
    1. Frades I, Matthiesen R. Overview on techniques in cluster analysis. Methods in molecular biology. 2010;593:81–107. full_text. - PubMed
    1. PubMed. http://www.ncbi.nlm.nih.gov/pubmed/

Publication types

MeSH terms

LinkOut - more resources