

Global analysis of phase locking in gene expression during cell cycle: the potential in network modeling
- PMID: 21129191
- PMCID: PMC3017040
- DOI: 10.1186/1752-0509-4-167
Global analysis of phase locking in gene expression during cell cycle: the potential in network modeling
Abstract
Background: In nonlinear dynamic systems, synchrony through oscillation and frequency modulation is a general control strategy to coordinate multiple modules in response to external signals. Conversely, the synchrony information can be utilized to infer interaction. Increasing evidence suggests that frequency modulation is also common in transcription regulation.
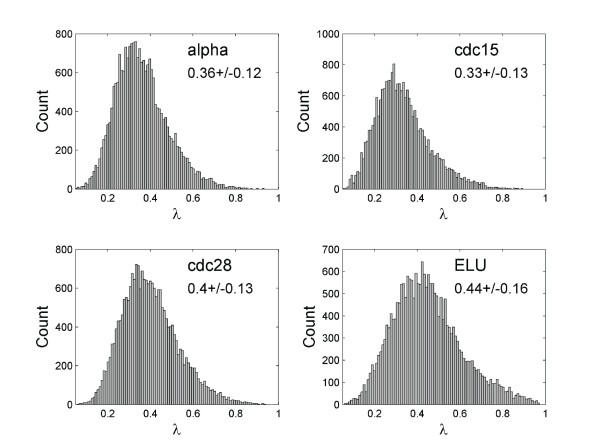
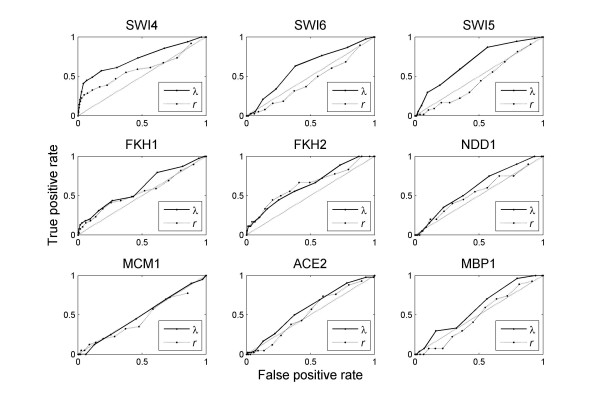
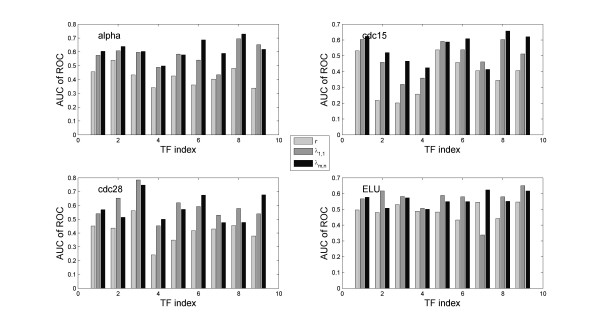
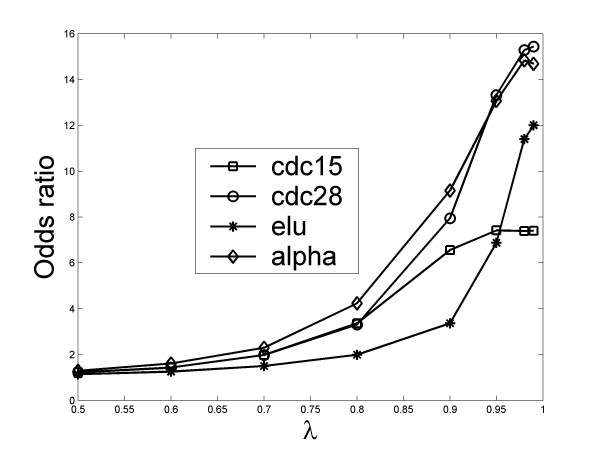
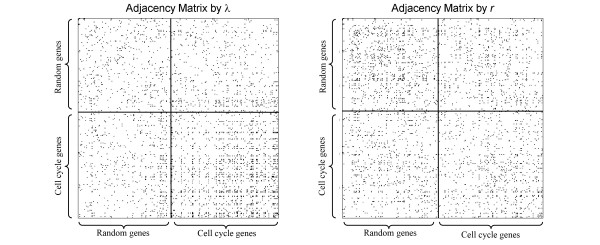
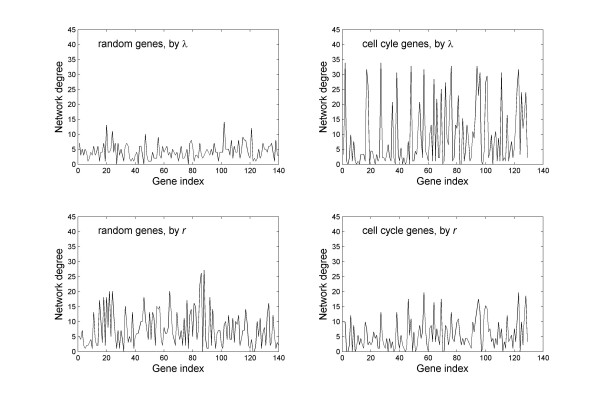
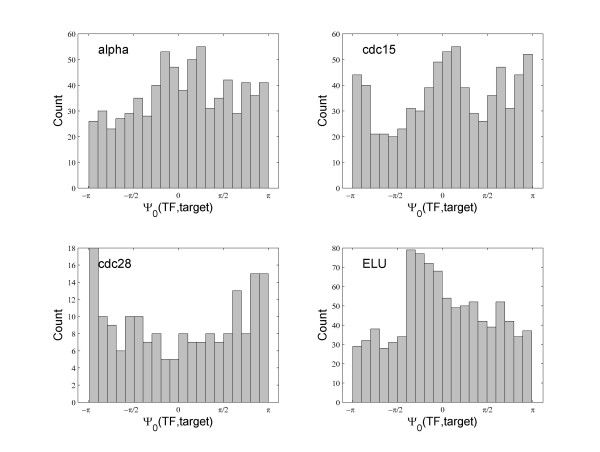
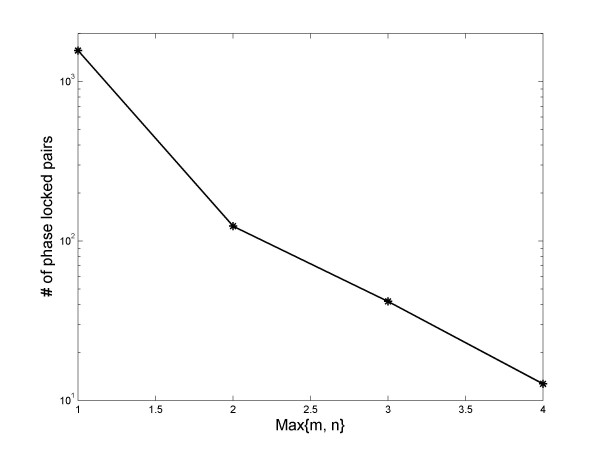
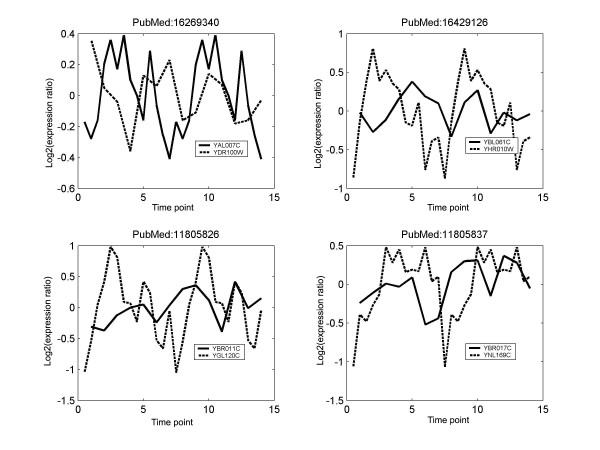
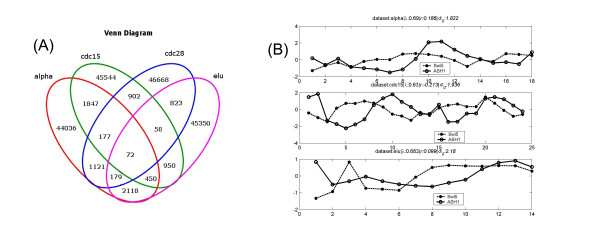
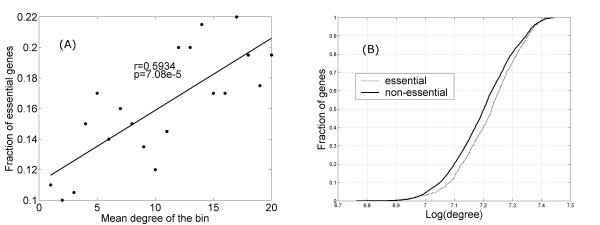
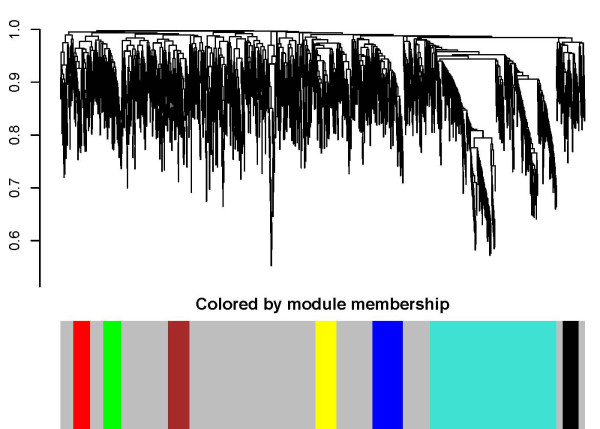
Results: In this study, we investigate the potential of phase locking analysis, a technique to study the synchrony patterns, in the transcription network modeling of time course gene expression data. Using the yeast cell cycle data, we show that significant phase locking exists between transcription factors and their targets, between gene pairs with prior evidence of physical or genetic interactions, and among cell cycle genes. When compared with simple correlation we found that the phase locking metric can identify gene pairs that interact with each other more efficiently. In addition, it can automatically address issues of arbitrary time lags or different dynamic time scales in different genes, without the need for alignment. Interestingly, many of the phase locked gene pairs exhibit higher order than 1:1 locking, and significant phase lags with respect to each other. Based on these findings we propose a new phase locking metric for network reconstruction using time course gene expression data. We show that it is efficient at identifying network modules of focused biological themes that are important to cell cycle regulation.
Conclusions: Our result demonstrates the potential of phase locking analysis in transcription network modeling. It also suggests the importance of understanding the dynamics underlying the gene expression patterns.
Figures
Similar articles
-
Identification of highly synchronized subnetworks from gene expression data.BMC Bioinformatics. 2013;14 Suppl 9(Suppl 9):S5. doi: 10.1186/1471-2105-14-S9-S5. Epub 2013 Jun 28. BMC Bioinformatics. 2013. PMID: 23901792 Free PMC article.
-
Reconstruction of gene regulatory modules in cancer cell cycle by multi-source data integration.PLoS One. 2010 Apr 21;5(4):e10268. doi: 10.1371/journal.pone.0010268. PLoS One. 2010. PMID: 20422009 Free PMC article.
-
A duplication growth model of gene expression networks.Bioinformatics. 2002 Nov;18(11):1486-93. doi: 10.1093/bioinformatics/18.11.1486. Bioinformatics. 2002. PMID: 12424120
-
Detecting biological associations between genes based on the theory of phase synchronization.Biosystems. 2008 May;92(2):99-113. doi: 10.1016/j.biosystems.2007.12.006. Epub 2008 Jan 11. Biosystems. 2008. PMID: 18289772
-
Statistical Network Inference for Time-Varying Molecular Data with Dynamic Bayesian Networks.Methods Mol Biol. 2019;1883:25-48. doi: 10.1007/978-1-4939-8882-2_2. Methods Mol Biol. 2019. PMID: 30547395 Review.
Cited by
-
Identification of highly synchronized subnetworks from gene expression data.BMC Bioinformatics. 2013;14 Suppl 9(Suppl 9):S5. doi: 10.1186/1471-2105-14-S9-S5. Epub 2013 Jun 28. BMC Bioinformatics. 2013. PMID: 23901792 Free PMC article.
-
Quantitative utilization of prior biological knowledge in the Bayesian network modeling of gene expression data.BMC Bioinformatics. 2011 Aug 31;12:359. doi: 10.1186/1471-2105-12-359. BMC Bioinformatics. 2011. PMID: 21884587 Free PMC article.
-
Comparing Host Module Activation Patterns and Temporal Dynamics in Infection by Influenza H1N1 Viruses.Front Immunol. 2021 Jul 14;12:691758. doi: 10.3389/fimmu.2021.691758. eCollection 2021. Front Immunol. 2021. PMID: 34335598 Free PMC article.
-
Interplay of microRNAs, transcription factors and target genes: linking dynamic expression changes to function.Nucleic Acids Res. 2013 Mar 1;41(5):2817-31. doi: 10.1093/nar/gks1471. Epub 2013 Jan 17. Nucleic Acids Res. 2013. PMID: 23335783 Free PMC article.
-
Synthetic biology tools for engineering Goodwin oscillation in Trypanosoma brucei brucei.Heliyon. 2022 Feb 3;8(2):e08891. doi: 10.1016/j.heliyon.2022.e08891. eCollection 2022 Feb. Heliyon. 2022. PMID: 35198764 Free PMC article.
References
-
- Burton P, Gurrin L, Sly P, (Eds) Extending the simple linear regression model to account for correlated responses: an introduction to generalized estimating equations and multi-level mixed modelling. England. 1998. - PubMed
Publication types
MeSH terms
Substances
Grants and funding
LinkOut - more resources
Full Text Sources
Molecular Biology Databases
