. 2010 Dec 4;17(1):91.
doi: 10.1186/1423-0127-17-91.

Regional characterization of energy metabolism in the brain of normal and MPTP-intoxicated mice using new markers of glucose and phosphate transport

Affiliations

Regional characterization of energy metabolism in the brain of normal and MPTP-intoxicated mice using new markers of glucose and phosphate transport

Emmanuelle Lagrue et al. J Biomed Sci. .

Abstract

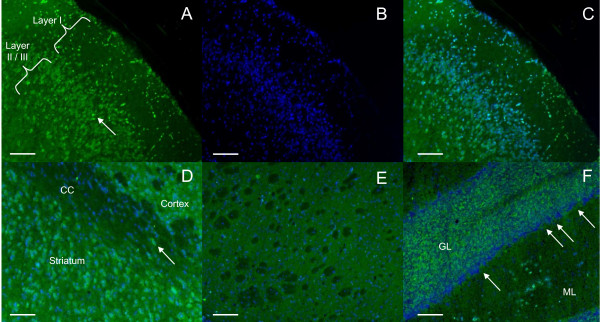
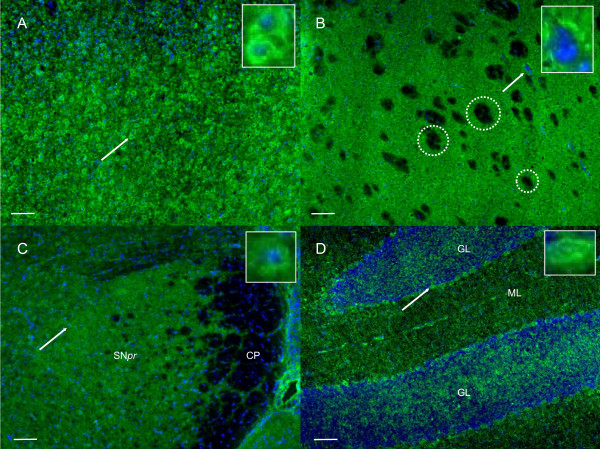
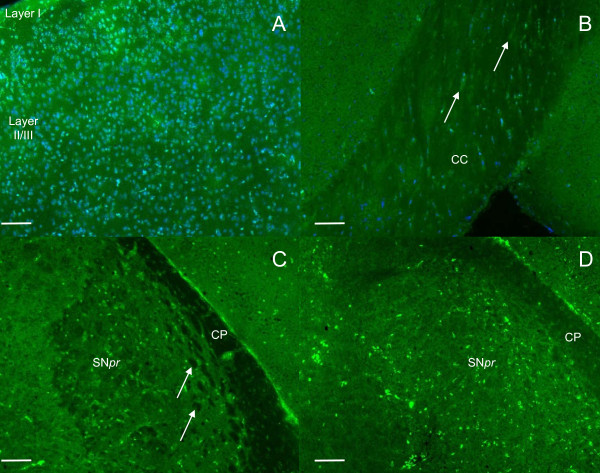
The gibbon ape leukemia virus (GALV), the amphotropic murine leukemia virus (AMLV) and the human T-cell leukemia virus (HTLV) are retroviruses that specifically bind nutrient transporters with their envelope glycoproteins (Env) when entering host cells. Here, we used tagged ligands derived from GALV, AMLV, and HTLV Env to monitor the distribution of their cognate receptors, the inorganic phosphate transporters PiT1 and PiT2, and the glucose transporter GLUT1, respectively, in basal conditions and after acute energy deficiency. For this purpose, we monitored changes in the distribution of PiT1, PiT2 and GLUT1 in the cerebellum, the frontal cortex, the corpus callosum, the striatum and the substantia nigra (SN) of C57/BL6 mice after administration of 1-methyl-4-phenyl-1,2,3,6 tetrahydropyridinium (MPTP), a mitochondrial complex I inhibitor which induces neuronal degeneration in the striato-nigral network.The PiT1 ligand stained oligodendrocytes in the corpus callosum and showed a reticular pattern in the SN. The PiT2 ligand stained particularly the cerebellar Purkinje cells, while GLUT1 labelling was mainly observed throughout the cortex, basal ganglia and cerebellar gray matter. Interestingly, unlike GLUT1 and PiT2 distributions which did not appear to be modified by MPTP intoxication, PiT1 immunostaining seemed to be more extended in the SN. The plausible reasons for this change following acute energy stress are discussed.These new ligands therefore constitute new metabolic markers which should help to unravel cellular adaptations to a wide variety of normal and pathologic conditions and to determine the role of specific nutrient transporters in tissue homeostasis.


Figures

Figure 1
Figure 1
GLUT1 immunostaining in normal mice. Cortex immunostaining: cells within layers I to IV exhibit a cytoplasmic staining. The staining is presented as follows: A: Alexa 488 signals (green) for GLUT1. The arrow indicates an example of stained cell; B: Hoecsht signals (blue) for the nuclear counterstaining; C: Alexa 488 signals (green) and Hoechst signals (blue) are merged; D: Corpus callosum (CC) staining: a few stained oligodendrocytes are seen (arrow). (Alexa 488 signal and Hoechst signals merged); E: Striatum staining: GLUT1 staining appears homogeneous and weak with few cellular bodies stained. The white-matter tracts are not labeled for GLUT1. (Alexa 488 signal and Hoechst signals merged); F: Cerebellum staining: The granular layer (GL) and the molecular layer (ML) are irregularly labelled for GLUT1, whereas the molecular layer is homogeneously labelled for PiT1 and PiT2. (Alexa 488 signal and Hoechst signals merged). Scale bar: 100 μm.
Figure 2
Figure 2
PiT2 immunostaining in normal mice. A: PiT2 immunostaining in the cortex of a normal mouse. In this representative image, the staining is detected in all cortical layers, with a "rosette like" aspect. The arrow indicates a characteristic stained neuron displayed in the enlarged inset (magnification x300). B: PiT2 immunostaining in the striatum of a normal mouse. Some PiT2-stained cells carry a "rosette like" pattern similar to that observed in the cortex (arrow and enlarged inset, magnification x300). Noteworthy, the white matter tracts are not stained (shown within dotted circles). C: PiT2 immunostaining in the substantia nigra (SN) of a normal mouse. PiT2 staining pattern in SN is comparable to the patterns observed in the cortex and the striatum with a "rosette like" aspect. The cerebral peduncle (white matter) does not show any PiT2 staining. The arrow points at a characteristic stained nigral cell as shown in the inset (magnification x300). D: PiT2 immunostaining in the cerebellum of a normal mouse. Purkinje cells are labelled with the PiT2 specific probe (arrow). Alexa 488 signals for PiT2 (green) and Hoechst signals for the nuclear counterstaining (blue) are merged. CP: cerebral peduncle, SNpr: substantia nigra pars reticulata, ML: molecular layer, GL: granular layer. Scale bar: 100 μm.
Figure 3
Figure 3
PiT1 immunostaining in normal and MPTP-intoxicated mice. A: PiT1 staining in the cortex of control mice; stained neurons are mostly detected in layer II/III. These neurons are medium-sized with homogeneous cytoplasmic staining. B: PiT1 immunostaining in the corpus callosum (CC) of normal mice: PiT1 labelling exhibits a linear pattern with few stained cells following the myelinated fiber bundles corresponding to oligodendrocytes (arrows). C: PiT1 immunostaining in the SN of normal mice with a reticular pattern due to a relative sparing of white-matter (arrows). D: PiT1 immunolabelling in MPTP intoxicated mice where an apparent extension of staining can be seen in the white-matter bundles in the substantia nigra pars reticulata (SNpr) and in the cerebral peduncle (CP). The staining is presented as follows: A to D, staining with Alexa 488 (green, PiT1 ligand) and A and B, signals are merged with Hoechst (blue, counterstaining for nuclei). Scale bar: 100 μm.

References

    1. Mandemakers W, Morais VA, De Strooper B. A cell biological perspective on mitochondrial dysfunction in Parkinson disease and other neurodegenerative diseases. J Cell Sci. 2007;120:1707–1716. doi: 10.1242/jcs.03443. - DOI - PubMed
    1. Mattson MP, Gleichmann M, Cheng A. Mitochondria in neuroplasticity and neurological disorders. Neuron. 2008;60:748–766. doi: 10.1016/j.neuron.2008.10.010. - DOI - PMC - PubMed
    1. Blomgren K, Hagberg H. Free radicals, mitochondriaand hypoxia-ischemia in the developing brain. Free Radic Biol Med. 2006;40:388–397. doi: 10.1016/j.freeradbiomed.2005.08.040. - DOI - PubMed
    1. Hartig MB, Hörtnagel K, Garavaglia B, Zorzi G, Kmiec T, Klopstock T, Rostasy K, Svetel M, Kostic VS, Schuelke M, Botz E, Weindl A, Novakovic I, Nardocci N, Prokisch H, Meitinger T. Genotypic and phenotypic spectrum of PANK2 mutations in patients with neurodegeneration with brain iron accumulation. Ann Neurol. 2006;59:248–256. doi: 10.1002/ana.20771. - DOI - PubMed
    1. Okun JG, Hörster F, Farkas LM, Feyh P, Hinz A, Sauer S, Hoffmann GF, Unsicker K, Mayatepek E, Kölker S. Neurodegeneration in methylmalonic aciduria involves inhibition of complex II and the tricarboxylic acid cycleand synergistically acting excitotoxicity. J Biol Chem. 2004;277:14674–14680. - PubMed

Publication types

MeSH terms