

Efficacy determinants of subcutaneous microdose glucagon during closed-loop control
- PMID: 21129323
- PMCID: PMC3005038
- DOI: 10.1177/193229681000400602
Efficacy determinants of subcutaneous microdose glucagon during closed-loop control
Abstract
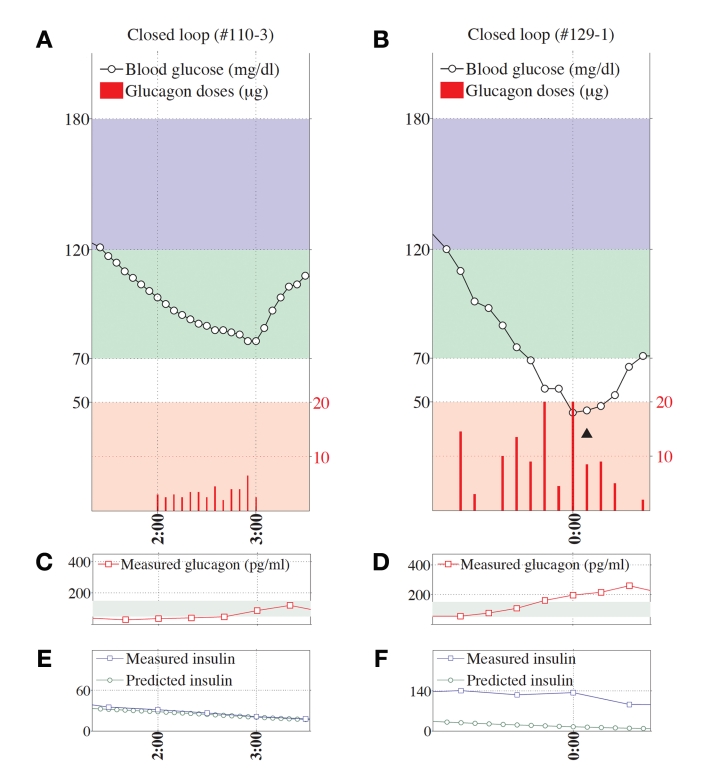
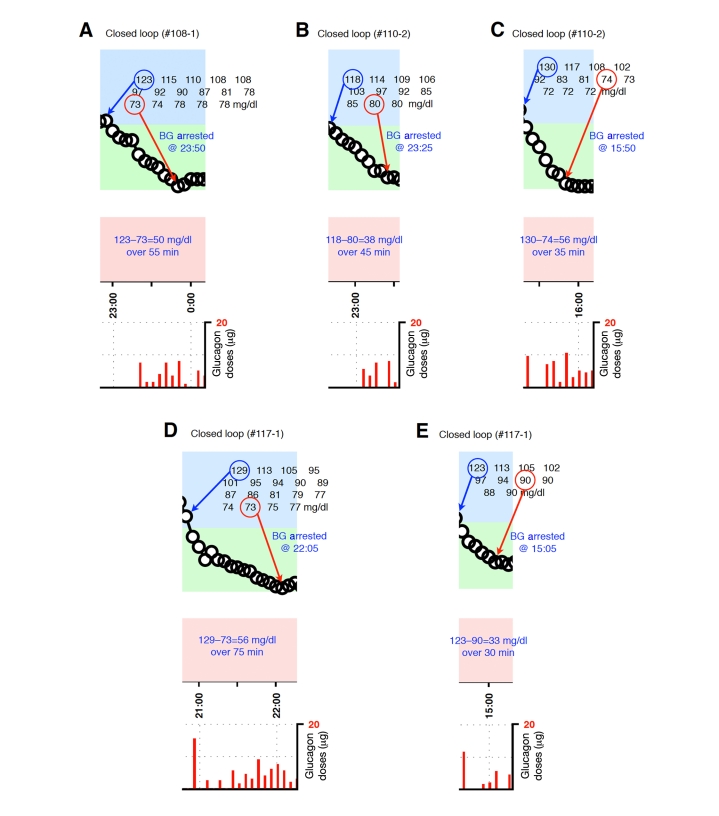
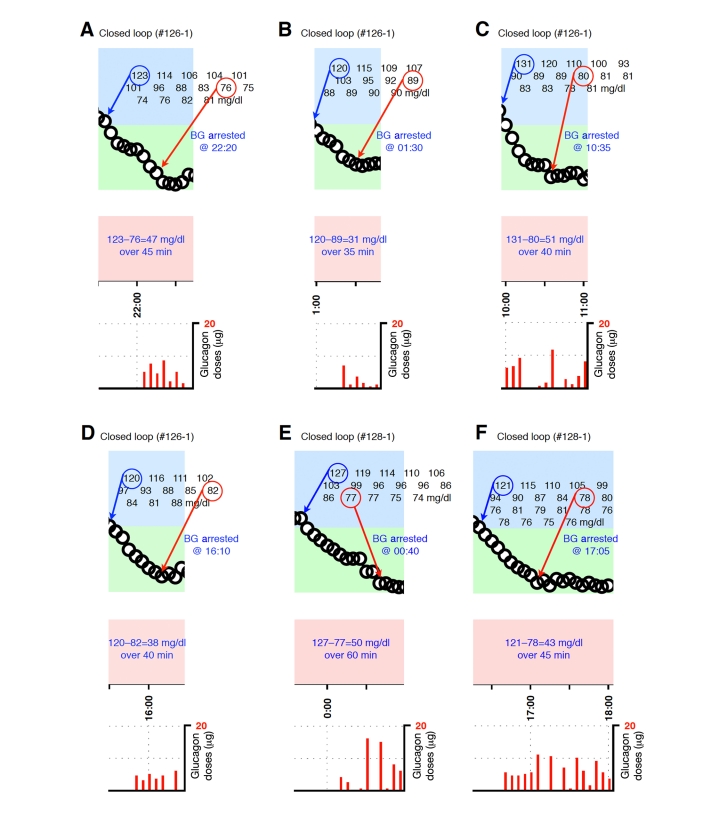
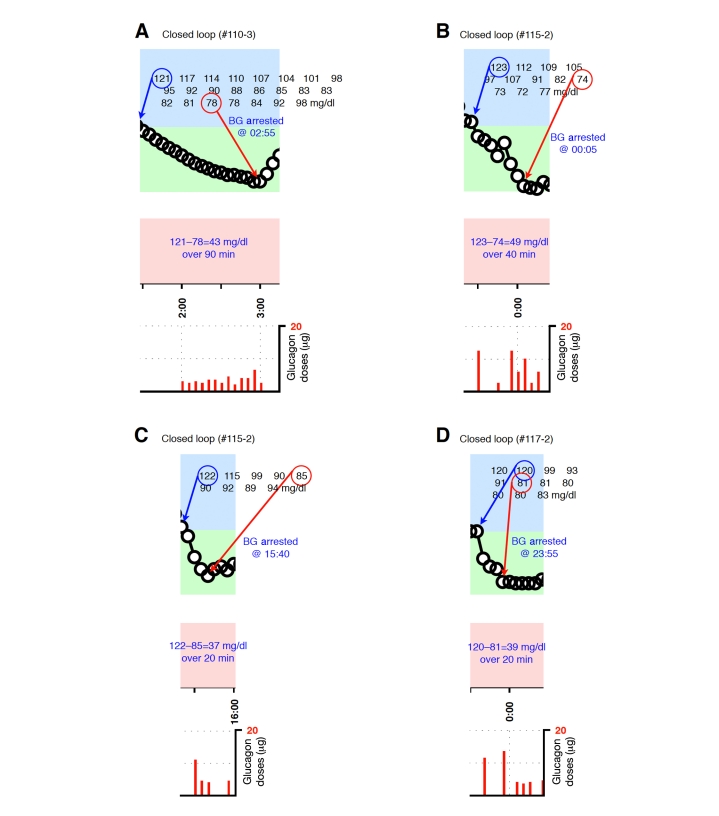
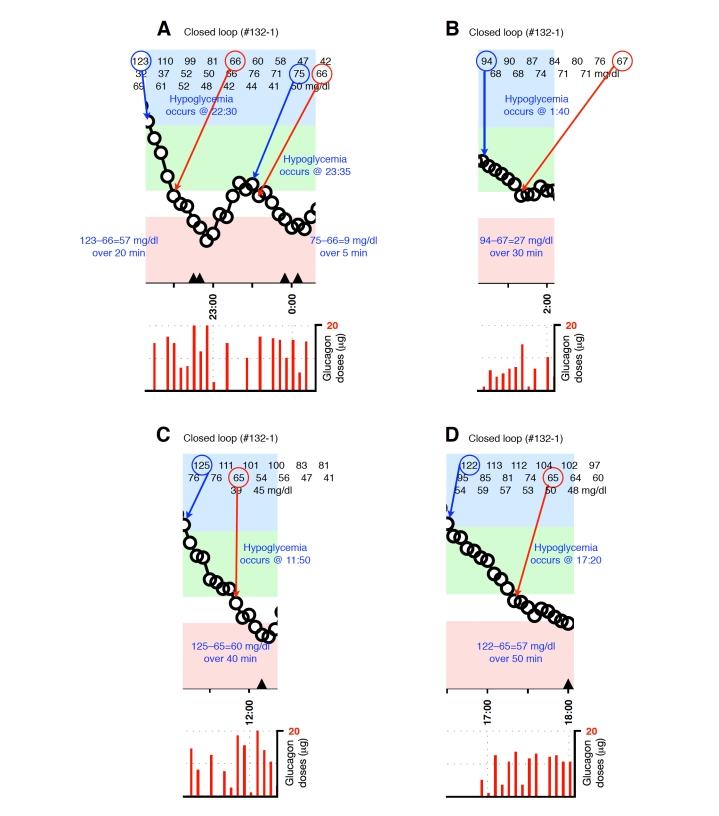
Background: During a previous clinical trial of a closed-loop blood glucose (BG) control system that administered insulin and microdose glucagon subcutaneously, glucagon was not uniformly effective in preventing hypoglycemia (BG<70 mg/dl). After a global adjustment of control algorithm parameters used to model insulin absorption and clearance to more closely match insulin pharmacokinetic (PK) parameters observed in the study cohort, administration of glucagon by the control system was more effective in preventing hypoglycemia. We evaluated the role of plasma insulin and plasma glucagon levels in determining whether glucagon was effective in preventing hypoglycemia.
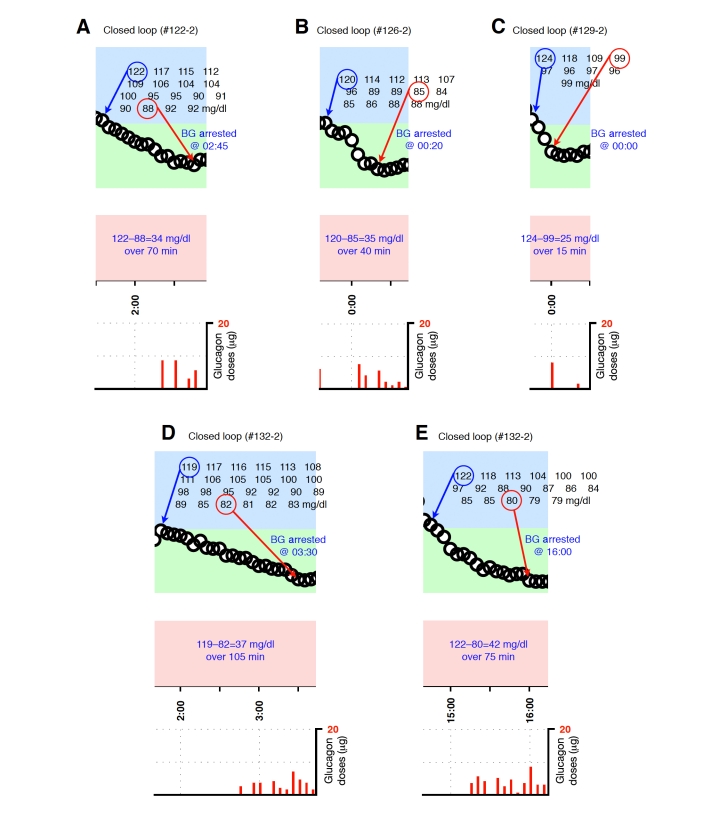
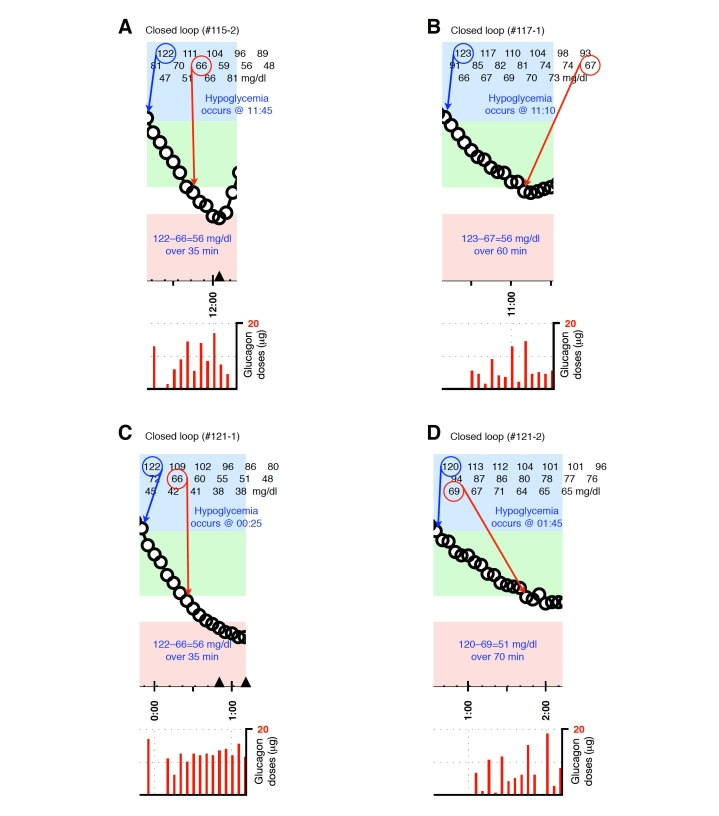
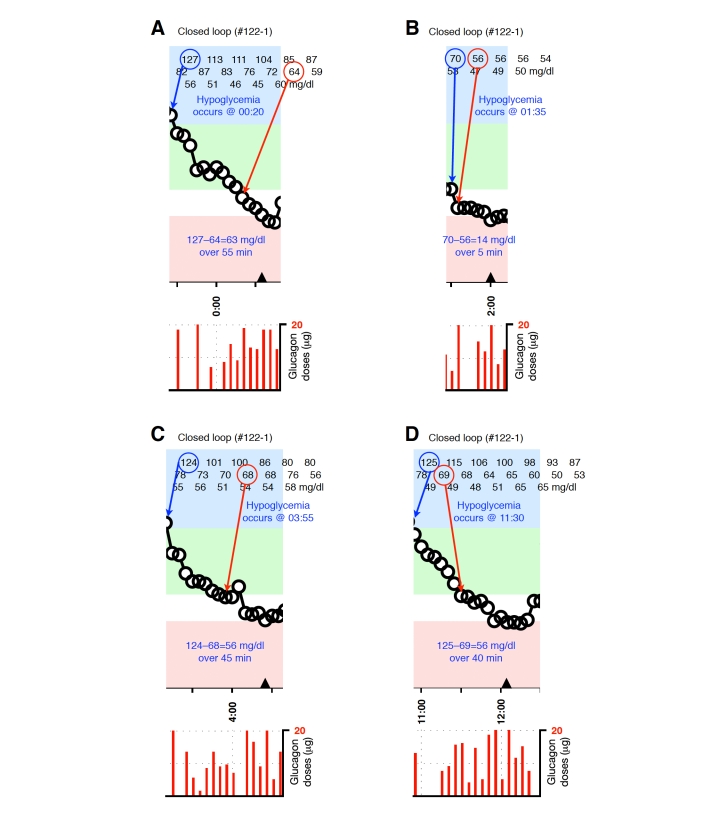
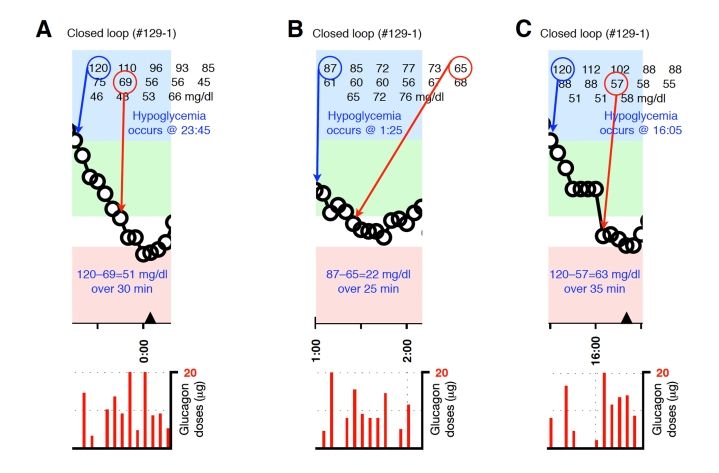
Methods: We identified and analyzed 36 episodes during which glucagon was given and categorized them as either successful or unsuccessful in preventing hypoglycemia.
Results: In 20 of the 36 episodes, glucagon administration prevented hypoglycemia. In the remaining 16, BG fell below 70 mg/dl (12 of the 16 occurred during experiments performed before PK parameters were adjusted). The (dimensionless) levels of plasma insulin (normalized relative to each subject's baseline insulin level) were significantly higher during episodes ending in hypoglycemia (5.2 versus 3.7 times the baseline insulin level, p=.01). The relative error in the control algorithm's online estimate of the instantaneous plasma insulin level was also higher during episodes ending in hypoglycemia (50 versus 30%, p=.003), as were the peak plasma glucagon levels (183 versus 116 pg/ml, p=.007, normal range 50-150 pg/ml) and mean plasma glucagon levels (142 versus 75 pg/ml, p=.02). Relative to mean plasma insulin levels, mean plasma glucagon levels tended to be 59% higher during episodes ending in hypoglycemia, although this result was not found to be statistically significant (p=.14). The rate of BG descent was also significantly greater during episodes ending in hypoglycemia (1.5 versus 1.0 mg/dl/min, p=.02).
Conclusions: Microdose glucagon administration was relatively ineffective in preventing hypoglycemia when plasma insulin levels exceeded the controller's online estimate by >60%. After the algorithm PK parameters were globally adjusted, insulin dosing was more conservative and microdose glucagon administration was very effective in reducing hypoglycemia while maintaining normal plasma glucagon levels. Improvements in the accuracy of the controller's online estimate of plasma insulin levels could be achieved if ultrarapid-acting insulin formulations could be developed with faster absorption and less intra- and intersubject variability than the current insulin analogs available today.
© 2010 Diabetes Technology Society.
Figures
Similar articles
-
Factors influencing the effectiveness of glucagon for preventing hypoglycemia.J Diabetes Sci Technol. 2010 Nov 1;4(6):1305-10. doi: 10.1177/193229681000400603. J Diabetes Sci Technol. 2010. PMID: 21129324 Free PMC article.
-
A bihormonal closed-loop artificial pancreas for type 1 diabetes.Sci Transl Med. 2010 Apr 14;2(27):27ra27. doi: 10.1126/scitranslmed.3000619. Sci Transl Med. 2010. PMID: 20393188 Free PMC article. Clinical Trial.
-
Overnight closed-loop insulin delivery with model predictive control: assessment of hypoglycemia and hyperglycemia risk using simulation studies.J Diabetes Sci Technol. 2009 Sep 1;3(5):1109-20. doi: 10.1177/193229680900300514. J Diabetes Sci Technol. 2009. PMID: 20144424 Free PMC article.
-
Insulin lispro: its role in the treatment of diabetes mellitus.Ann Pharmacother. 1996 Nov;30(11):1263-71. doi: 10.1177/106002809603001111. Ann Pharmacother. 1996. PMID: 8913409 Review.
-
[What is the current state of the artificial pancreas in diabetes care?].Internist (Berl). 2020 Jan;61(1):102-109. doi: 10.1007/s00108-019-00713-y. Internist (Berl). 2020. PMID: 31863132 Review. German.
Cited by
-
Systematically in silico comparison of unihormonal and bihormonal artificial pancreas systems.Comput Math Methods Med. 2013;2013:712496. doi: 10.1155/2013/712496. Epub 2013 Oct 24. Comput Math Methods Med. 2013. PMID: 24260042 Free PMC article.
-
Safety and efficacy of 24-h closed-loop insulin delivery in well-controlled pregnant women with type 1 diabetes: a randomized crossover case series.Diabetes Care. 2011 Dec;34(12):2527-9. doi: 10.2337/dc11-1430. Epub 2011 Oct 19. Diabetes Care. 2011. PMID: 22011408 Free PMC article. Clinical Trial.
-
Realizing a Closed-Loop (Artificial Pancreas) System for the Treatment of Type 1 Diabetes.Endocr Rev. 2019 Dec 1;40(6):1521-1546. doi: 10.1210/er.2018-00174. Endocr Rev. 2019. PMID: 31276160 Free PMC article. Review.
-
Insulin-and-Glucagon Artificial Pancreas Versus Insulin-Alone Artificial Pancreas: A Short Review.Diabetes Spectr. 2019 Aug;32(3):215-221. doi: 10.2337/ds18-0097. Diabetes Spectr. 2019. PMID: 31462876 Free PMC article.
-
The artificial pancreas: two alternative approaches to achieve a fully closed-loop system with optimal glucose control.J Endocrinol Invest. 2024 Mar;47(3):513-521. doi: 10.1007/s40618-023-02193-2. Epub 2023 Sep 15. J Endocrinol Invest. 2024. PMID: 37715091 Free PMC article. Review.
References
-
- The Diabetes Control and Complications Trial Research Group (DCCT) The effect of intensive treatment of diabetes on the development and progression of long-term complications in insulin dependent diabetes mellitus. N Engl J Med. 1993;329(14):977–986. - PubMed
-
- Ray KK, Seshasai SR, Wijesuriya S, Sivakumaran R, Nethercott S, Preiss D, Erqou S, Sattar N. Effect of intensive control of glucose on cardiovascular outcomes and death in patients with diabetes mellitus: a meta-analysis of randomised controlled trials. Lancet. 2009;373(9677):1765–1772. - PubMed
-
- Sternberg F, Meyerhoff C, Mennel FJ, Bischof F, Pfeiffer EF. Subcutaneous glucose concentration in humans. Real estimation and continuous monitoring. Diabetes Care. 1995;18(9):1266–1269. - PubMed
-
- Steil GM, Rebrin K, Darwin C, Hariri F, Saad MF. Feasibility of automating insulin delivery for the treatment of type 1 diabetes. Diabetes. 2006;55(12):3344–3350. - PubMed
-
- Weinzimer S, Steil GM, Swan KL, Dziura J, Kurtz N, Tamborlane WV. Fully automated closed-loop insulin delivery versus semiautomated hybrid control in pediatric patients with type 1 diabetes using an artificial pancreas. Diabetes Care. 2008;31(5):934–939. - PubMed
Publication types
MeSH terms
Substances
Grants and funding
LinkOut - more resources
Full Text Sources
Other Literature Sources
Medical
