. 2010 Dec 10;143(6):1005-17.
doi: 10.1016/j.cell.2010.11.013. Epub 2010 Dec 2.

An integrated approach to uncover drivers of cancer

Affiliations

An integrated approach to uncover drivers of cancer

Uri David Akavia et al. Cell. .

Abstract

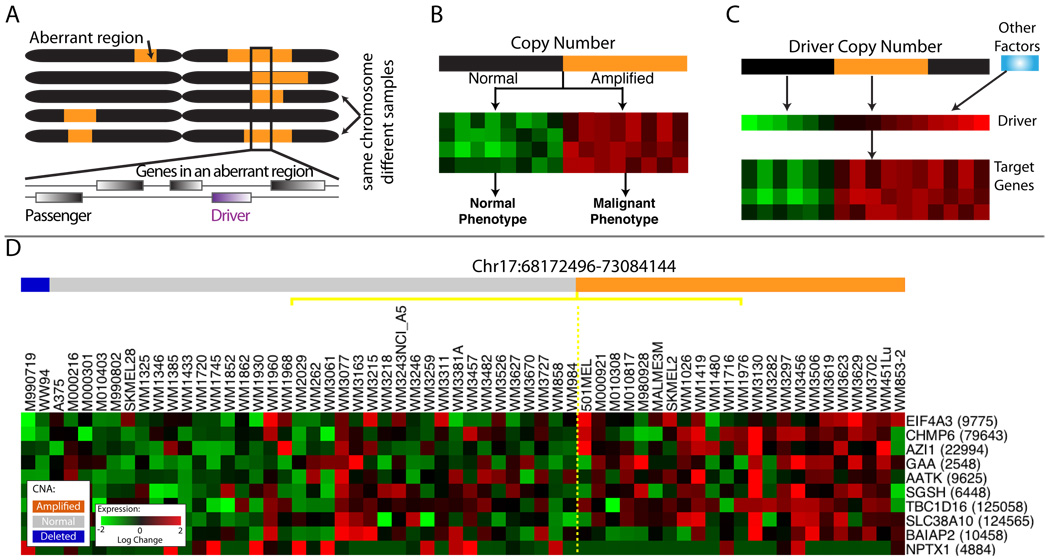
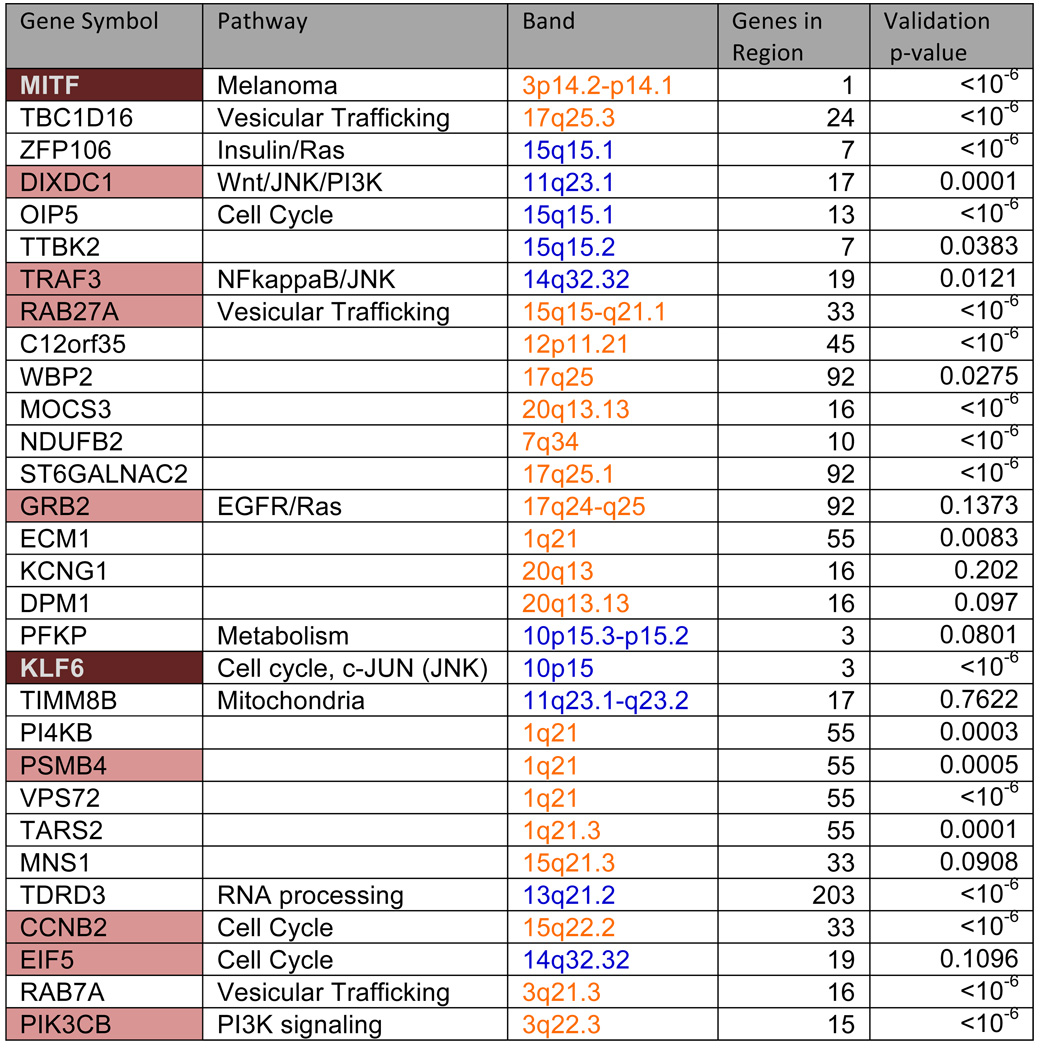
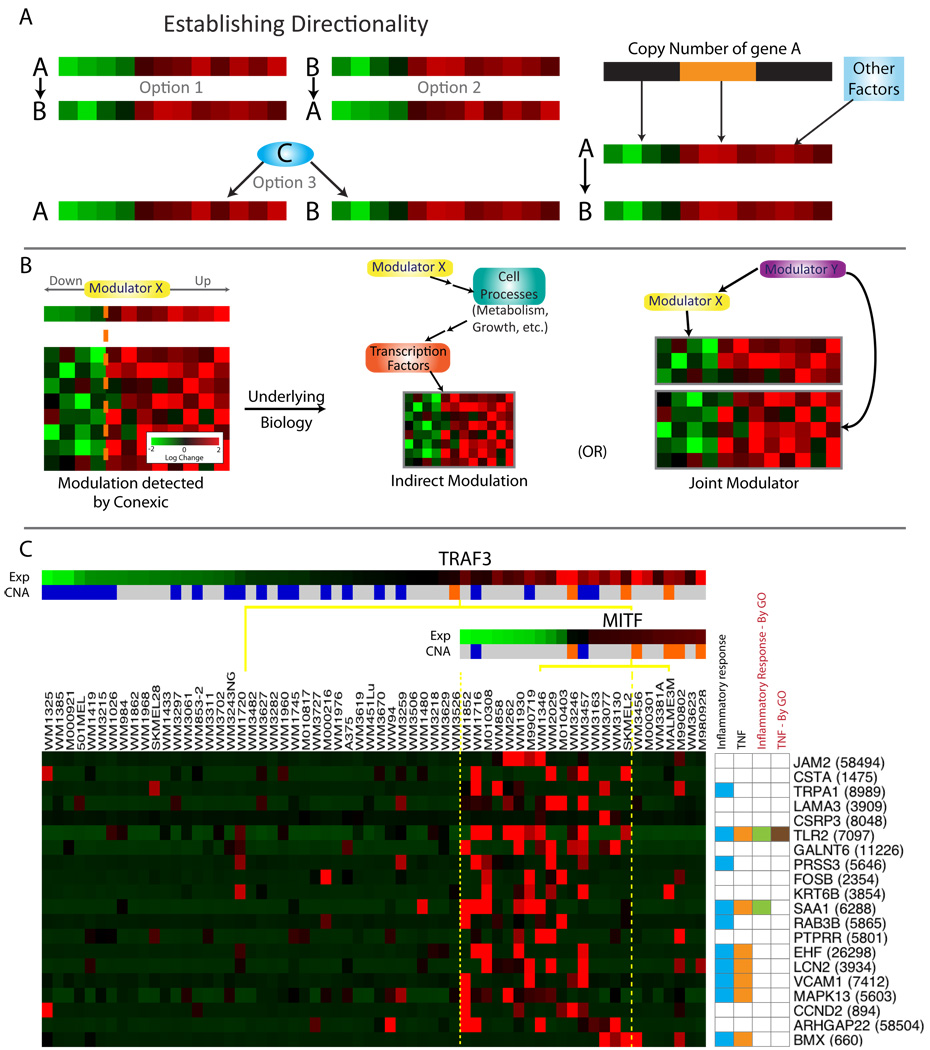
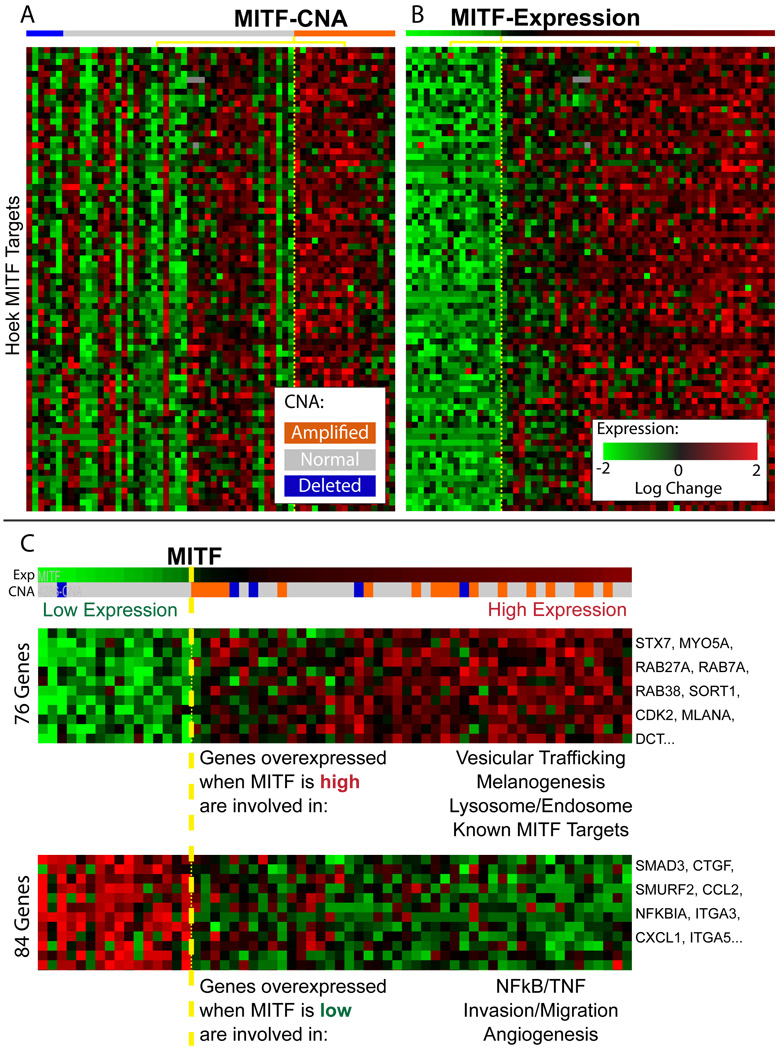
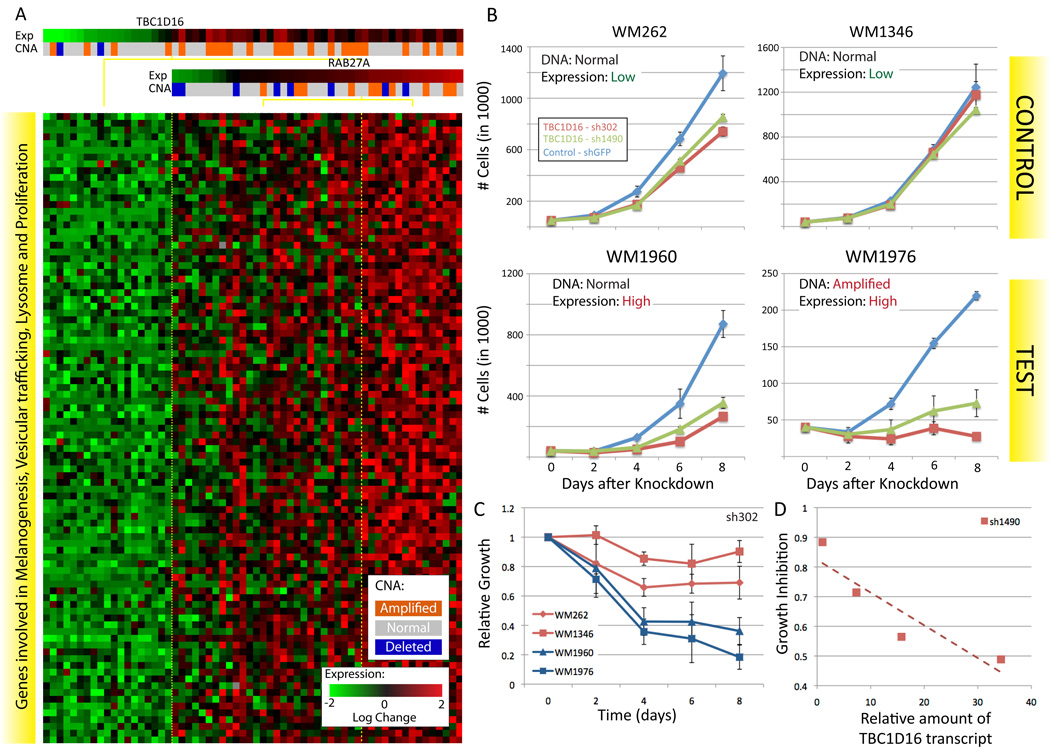
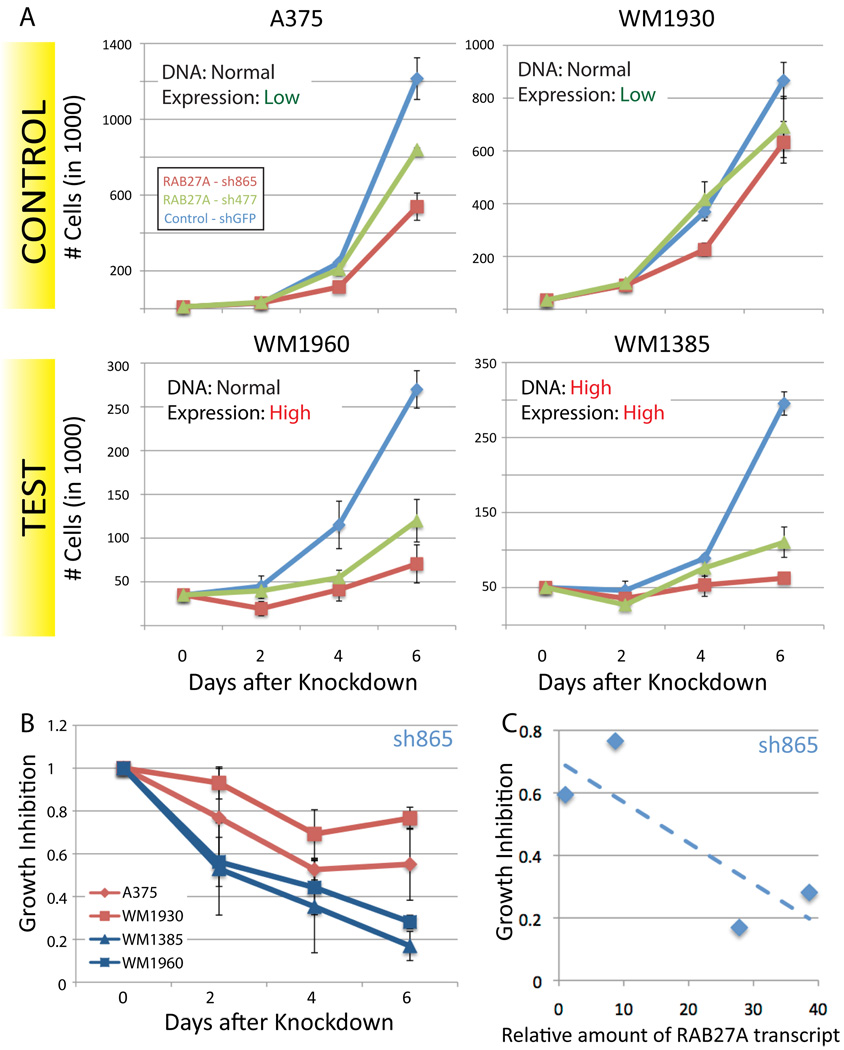
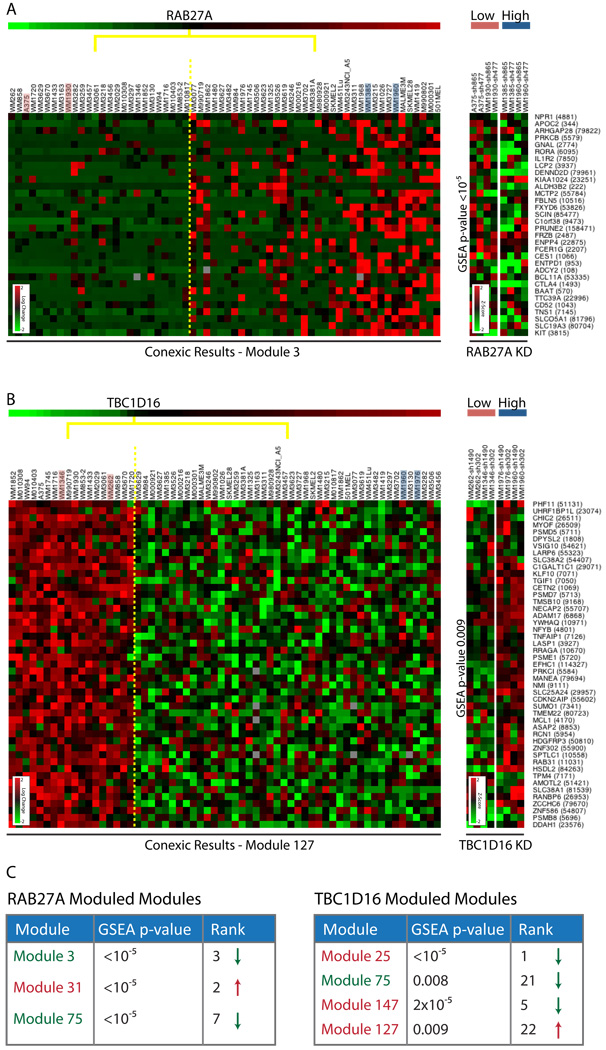
Systematic characterization of cancer genomes has revealed a staggering number of diverse aberrations that differ among individuals, such that the functional importance and physiological impact of most tumor genetic alterations remain poorly defined. We developed a computational framework that integrates chromosomal copy number and gene expression data for detecting aberrations that promote cancer progression. We demonstrate the utility of this framework using a melanoma data set. Our analysis correctly identified known drivers of melanoma and predicted multiple tumor dependencies. Two dependencies, TBC1D16 and RAB27A, confirmed empirically, suggest that abnormal regulation of protein trafficking contributes to proliferation in melanoma. Together, these results demonstrate the ability of integrative Bayesian approaches to identify candidate drivers with biological, and possibly therapeutic, importance in cancer.


Figures

Figure 1
Figure 1. Modeling assumptions
For all heat maps, each row represents a gene and each column represents a tumor sample. A. The same chromosome in different tumors, orange represents amplified regions. The box shows regions amplified in multiple tumors. B. An idealized signature in which the target genes are up-regulated (red) when the DNA encoding the driver is amplified (orange). C. A driver may be overexpressed due to amplification of the DNA encoding it, or due to the action of other factors. The target genes correlate with driver gene expression (middle row), rather than driver copy number (top row). D. Data representing amplified region on chromosome 17. Heat maps of expression for 10/24 genes that passed initial expression filtering (Supplementary methods). Samples are ordered according to amplification status of the region (Orange amplified, blue deleted). These genes are identical in their amplification status and while gene expression is correlated with amplification status to some degree, the expression of each gene is unique. It is these differences that facilitate the identification of the driver. See also Supplementary Methods, Figure S1, Table S1.
Figure 2
Figure 2. The highest scoring modulators identified by CONEXIC
Gene names are color-coded based on the role of the gene in cancer, 10 genes have been previously identified as oncogenes or tumor suppressors (peach), of these 3 in melanoma (brown). Column 3 represents chromosomal location, where orange represents amplification and blue represents deletion. These genes were identified within regions containing multiple genes, the number of genes in each aberrant region is listed in column 4. Column 5 lists the p-value for modulator validation in independent data (for a full list, see Table S2 and Figure S2C). p-values are shown for the Johansson dataset, unless the modulator was missing from this dataset, and then p-value from the Hoek dataset is shown. See also Supplementary Methods, Table S2, Figure S2.
Figure 3
Figure 3. Associating modulators to genes
A. Three scenarios could explain a correlation between a candidate driver (gene A) and its target (gene B): A could influence B, B influence A, or both could be regulated by a common third mechanism (Pearl, 2000). The availability of both gene expression and chromosomal copy number data allows us to establish the likely direction of influence. If the expression of gene A is correlated with its DNA copy number, and the copy number is altered in a large number of tumors, it is likely that the copy number alteration results in a change in expression of A in these tumors. So the model in which A influences the expression of B and other correlated genes is the most likely. In this way, examination of both copy number and gene expression in a single integrated computational framework facilitates identification of candidate drivers. B. Modulator influence on a module can go beyond direct transcriptional cascades involving transcription factors or signaling proteins and their targets. Genetic alteration of any gene (e.g., a metabolic enzyme) can alter cell physiology, which is sensed by the cell and subsequently leads to a transcriptional response through a cascade of indirect influences and mechanisms. While modules are typically enriched for genes influenced by the modulator, they also contain genes that are coexpressed with the modulator ('joint modulator'). Both types are helpful for annotating the module and determining the functional role of the modulator. C. The TNF module. The modulators include TRAF3 and MITF, where high TRAF3 and low MITF are required for upregulation of the genes in the module. The annotation for each gene is represented in a color-coded matrix. Blue and orange squares represent literature-based annotation (see Table S3); green and brown are from GO. LitVAN associated the genes in this module with TNF and the inflammatory response. See also Figure S3, Table S3.
Figure 4
Figure 4. MITF expression correlates with expression of the genes in the associated module
A. Each row represents the gene expression of one of 78 MITF targets identified by Hoek (Hoek et al., 2008b); the tumor samples are split into two groups based on the copy number of MITF (Welch t-test p-value=0.04) B. The rows represent the same genes, in the same order as in A, but here the tumor samples are split into a group of samples that express MITF at high (n=46) or low levels (n=16) Welch t-test p-value=0.0001). C. Two modules associated with MITF, showing a selected subset of genes. LitVAN annotation for the genes in each module is shown below the heat map. The complete modules with all genes are available in Figure S4.
Figure 5
Figure 5. TBC1D16 is necessary for melanoma growth
A. A module associated with TBC1D16 and RAB27A, the genes in the module are involved in melanogenesis, survival/proliferation, lysosome and protein trafficking (see Table S4A for details). B. Representative growth curves for each of the 4 STCs infected with TBC1D16 shRNA, each curve represents 3 technical replicates. RT-PCR was used to confirm that the reduction in the amount of the TBC1D16 transcript was similar for all of the STCs (Figure S5). C. Change in growth over time, relative to the number of cells plated, averaged over all replicates (Supplementary methods). Mean over 3 biological replicates X 3 technical replicates for each STC, see Figure S5 and Table S4B for additional replicates and hairpins. D. Growth inhibition at 8 days is directly proportional to the amount of the TBC1D16 transcript and is independent of the TBC1D16 copy number.
Figure 6
Figure 6. RAB27A is necessary for melanoma growth
A. Representative growth curves for each of the 4 STCs infected with RAB27A shRNA, each curve represents 3 technical replicates. RT-PCR was used to confirm that the reduction in the amount of the RAB27A transcript was similar in all of the STCs (Figure S6). B. Change in growth over time, relative to the number of cells plated, averaged over all replicates. Knockdown of RAB27A expression in cells that express this gene at high levels reduces proliferation. Data averaged over all replicates for each STC, see Figure S6 and Table S5 for all data. C. Growth inhibition at 6 days is dependent on the amount of the RAB27A transcript and is independent of RAB27A copy number.
Figure 7
Figure 7. Results of knockdown microarrays for RAB27A and TBC1D16
A. To the left is one of the modules associated with RAB27A and to the right data generated following knockdown (KD) of RAB27A for the same genes in the STCs indicated (pink and blue). The expression of genes in the module goes down relative to shGFP as predicted, KD expression heatmap shows Z-scores (see Supplementary Materials) showing that these are some of the most differentially expressed genes (DEGs) in the genome. B. To the left is one of the modules associated with TBC1D16 and to the right data generated following KD of TBC1D16 in the STCs indicated. The expression of genes in the module goes up relative to shGFP, as predicted. The test STCs (blue) and control STCs (pink) respond differently demonstrating the importance of context (TBC1D16 over-expression status) in determining the response. C. GSEA p-value and ranking (relative to 177 CONEXIC modules) for RAB27A and TBC1D16 associated modules (see Figure S7 for data). GSEA was calculated using the median of 4 profiles (2 cell lines X 2 hairpins) on the test STCs. Significant p-values indicate that knockdown of RAB27A and TBC1D16 each affect the subset of genes predicted by CONEXIC (note that 10−5 is the smallest p-value possible given that 100,000 permutations are used). The color of the module name represents the predicted direction of response to knockdown (red and green represent up and down regulated, respectively). The arrow represents the observed response to knockdown. The direction of response was correctly predicted for 2/4 TBC1D16 modules and for all RAB27A modules. See also Figure S7, Table S6.

Comment in

Similar articles

Cited by

References

    1. Adler AS, Lin M, Horlings H, Nuyten DS, van de Vijver MJ, Chang HY. Genetic regulators of large-scale transcriptional signatures in cancer. Nat Genet. 2006;38:421–430. - PMC - PubMed
    1. Beroukhim R, Brunet J-P, Di Napoli A, Mertz KD, Seeley A, Pires MM, Linhart D, Worrell RA, Moch H, Rubin MA, et al. Patterns of Gene Expression and Copy-Number Alterations in von-Hippel Lindau Disease-Associated and Sporadic Clear Cell Carcinoma of the Kidney. Cancer Res. 2009;69:4674–4681. - PMC - PubMed
    1. Beroukhim R, Getz G, Nghiemphu L, Barretina J, Hsueh T, Linhart D, Vivanco I, Lee JC, Huang JH, Alexander S, et al. Assessing the significance of chromosomal aberrations in cancer: methodology and application to glioma. Proc Natl Acad Sci USA. 2007;104:20007–20012. - PMC - PubMed
    1. Beroukhim R, Mermel CH, Porter D, Wei G, Raychaudhuri S, Donovan J, Barretina J, Boehm JS, Dobson J, Urashima M, et al. The landscape of somatic copy-number alteration across human cancers. Nature. 2010;463:899–905. - PMC - PubMed
    1. Bric A, Miething C, Bialucha CU, Scuoppo C, Zender L, Krasnitz A, Xuan Z, Zuber J, Wigler M, Hicks J, et al. Functional Identification of Tumor-Suppressor Genes through an In Vivo RNA Interference Screen in a Mouse Lymphoma Model. Cancer Cell. 2009;16:324–335. - PMC - PubMed

Publication types

MeSH terms

Substances

Associated data