

Approximate entropy used to assess sitting postural sway of infants with developmental delay
- PMID: 21129778
- PMCID: PMC3032039
- DOI: 10.1016/j.infbeh.2010.10.001
Approximate entropy used to assess sitting postural sway of infants with developmental delay
Abstract
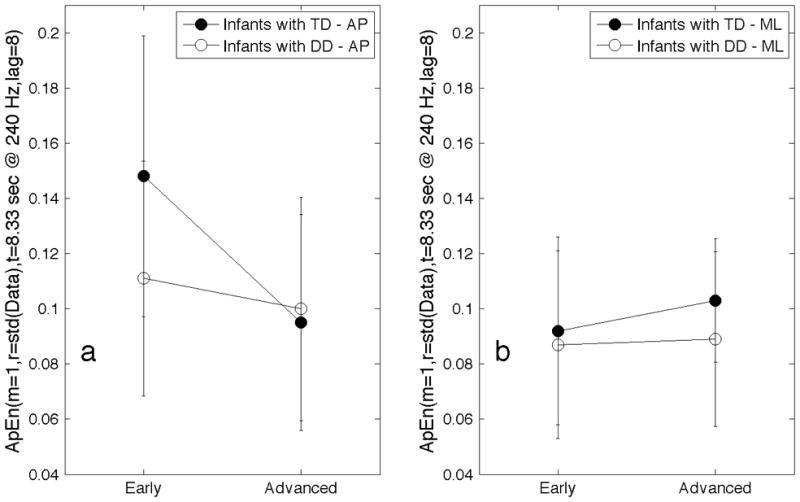
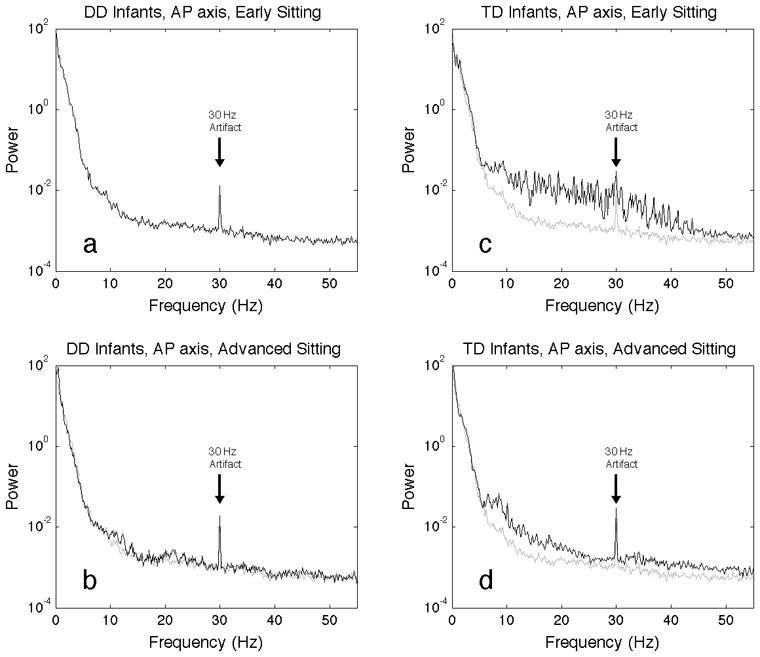
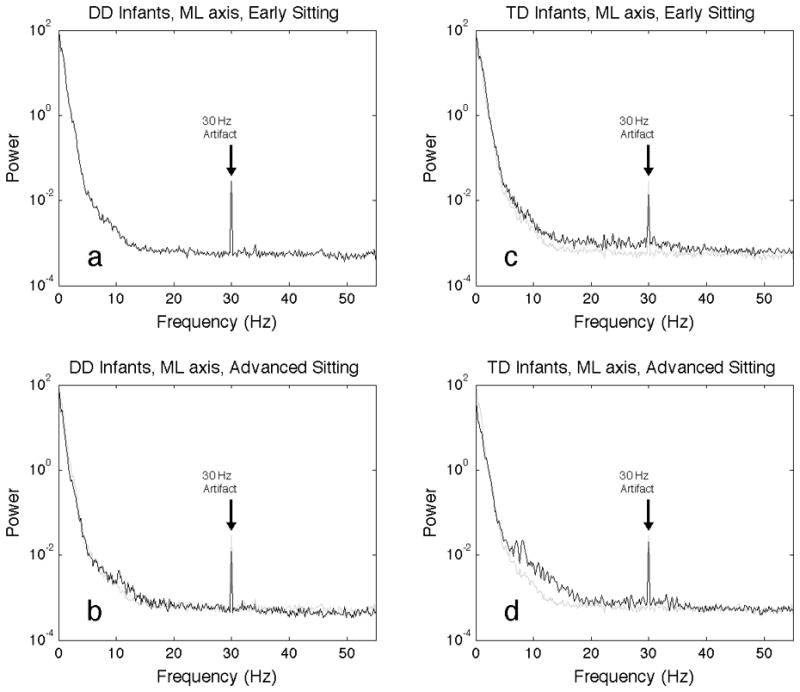
Infant sitting postural sway provides a window into motor development at an early age. The approximate entropy, a measure of randomness, in the postural sway was used to assess developmental delay, as occurs in cerebral palsy. Parameters used for the calculation of approximate entropy were investigated, and approximate entropy of postural sway in early sitting was found to be lower for infants with developmental delay in the anterior-posterior axis, but not in the medial-lateral axis. Spectral analysis showed higher frequency features in the postural sway of early sitting of infants with typical development, suggesting a faster control mechanism is active in infants with typical development as compared to infants with delayed development, perhaps activated by near-fall events.
Copyright © 2010 Elsevier Inc. All rights reserved.
Figures
Similar articles
-
Use of information entropy measures of sitting postural sway to quantify developmental delay in infants.J Neuroeng Rehabil. 2009 Aug 11;6:34. doi: 10.1186/1743-0003-6-34. J Neuroeng Rehabil. 2009. PMID: 19671183 Free PMC article.
-
Nonlinear analysis of sitting postural sway indicates developmental delay in infants.Clin Biomech (Bristol). 2009 Aug;24(7):564-70. doi: 10.1016/j.clinbiomech.2009.05.004. Epub 2009 Jun 2. Clin Biomech (Bristol). 2009. PMID: 19493596
-
Reliability of center of pressure measures for assessing the development of sitting postural control in infants with or at risk of cerebral palsy.Arch Phys Med Rehabil. 2010 Oct;91(10):1593-601. doi: 10.1016/j.apmr.2010.06.027. Arch Phys Med Rehabil. 2010. PMID: 20875520 Free PMC article.
-
Primitive reflexes and postural reactions in the neurodevelopmental examination.Pediatr Neurol. 2004 Jul;31(1):1-8. doi: 10.1016/j.pediatrneurol.2004.01.012. Pediatr Neurol. 2004. PMID: 15246484 Review.
-
Postural synergies and their development.Neural Plast. 2005;12(2-3):119-30; discussion 263-72. doi: 10.1155/NP.2005.119. Neural Plast. 2005. PMID: 16097480 Free PMC article. Review.
Cited by
-
The effect of educational gymnastics on postural control of young children.Front Psychol. 2022 Aug 10;13:936680. doi: 10.3389/fpsyg.2022.936680. eCollection 2022. Front Psychol. 2022. PMID: 36033080 Free PMC article.
-
Entropy measures, entropy estimators, and their performance in quantifying complex dynamics: Effects of artifacts, nonstationarity, and long-range correlations.Phys Rev E. 2017 Jun;95(6-1):062114. doi: 10.1103/PhysRevE.95.062114. Epub 2017 Jun 12. Phys Rev E. 2017. PMID: 28709192 Free PMC article.
-
The development of motor behavior.Wiley Interdiscip Rev Cogn Sci. 2017 Jan;8(1-2):10.1002/wcs.1430. doi: 10.1002/wcs.1430. Epub 2016 Dec 1. Wiley Interdiscip Rev Cogn Sci. 2017. PMID: 27906517 Free PMC article. Review.
-
A multi-level analysis of motor and behavioural dynamics in 9-month-old preterm and term-born infants during changing emotional and interactive contexts.Sci Rep. 2025 Jan 6;15(1):952. doi: 10.1038/s41598-024-83194-w. Sci Rep. 2025. PMID: 39762299 Free PMC article.
-
Nonlinear analysis of postural sway in subjects with below knee amputation during opened and closed eye conditions.J Orthop. 2016 Apr 1;13(3):152-6. doi: 10.1016/j.jor.2016.03.009. eCollection 2016 Sep. J Orthop. 2016. PMID: 27408487 Free PMC article.
References
-
- Bertenthal BI, Rose JL, Bai DL. Perception-action coupling in the development of visual control of posture. Journal of Experimental Psychology Human Perception and Performance. 1997;23(6):1631–1643. - PubMed
-
- Blauw-Hospers CH, de Graaf-Peters VB, Dirks T, Bos AF, Hadders-Algra M. Does early intervention in infants at high risk for a developmental motor disorder improve motor and cognitive development? Neuroscience and Biobehavioral Reviews. 2007;31(8):1201–1212. - PubMed
Publication types
MeSH terms
Grants and funding
LinkOut - more resources
Full Text Sources
Medical
