. 2011 Mar;6(2):143-57.
doi: 10.1016/j.scr.2010.10.003. Epub 2010 Oct 30.

Elimination of tumorigenic stem cells from differentiated progeny and selection of definitive endoderm reveals a Pdx1+ foregut endoderm stem cell lineage

Affiliations

Elimination of tumorigenic stem cells from differentiated progeny and selection of definitive endoderm reveals a Pdx1+ foregut endoderm stem cell lineage

Brenda Kahan et al. Stem Cell Res. 2011 Mar.

Abstract

Embryonic stem cell (ESC) derivatives offer promise for generating clinically useful tissues for transplantation, yet the specter of producing tumors in patients remains a significant concern. We have developed a simple method that eliminates the tumorigenic potential from differentiated ESC cultures of murine and human origin while purifying lineage-restricted, definitive endoderm-committed cells. A three-stage scheme utilizing magnetic bead sorting and specific antibodies to remove undifferentiated ESCs and extraembryonic endoderm cells, followed by positive selection of definitive endoderm cells on the basis of epithelial cell adhesion molecule (EpCAM) expression, was used to isolate a population of EpCAM(+)SSEA1(-)SSEA3(-) cells. Sorted cells do not form teratomas after transplantation into immunodeficient mice, but display gene and protein expression profiles indicative of definitive endoderm cells. Sorted cells could be subsequently expanded in vitro and further differentiated to express key pancreas specification proteins. In vivo transplantation of sorted cells resulted in small, benign tissues that uniformly express PDX1. These studies describe a straightforward method without genetic manipulation that eliminates the risk of teratoma formation from ESC differentiated derivatives. Significantly, enriched populations isolated by this method appear to be lineage-restricted definitive endoderm cells with limited proliferation capacity.


Figures

Fig 1
Fig 1
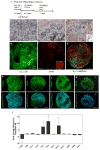
Protein and transcript expression profiles of differentiated ESC mass cultures prior to sorting at EB7+21. (a) Nuclear PDX1 and EpCAM are co-expressed in many areas of the unsorted culture; (b) in some regions, not all EpCAM+ cells express PDX1, yet the majority of PDX1+ cells do express EpCAM. (c) EpCAM is not present on cells that express K14, a marker of basal cells of stratified squamous epithelia which are common cell types in differentiated ESCs (top), or in a human keratinocyte stem cell culture (bottom); (d–g) EpCAM is not co-expressed with neural or mesenchymal markers (Vimentin, striated Myosin, β-Tubulin, Nestin); Scale bars, 50μm. (h) Temporal expression patterns of key mesendoderm and definitive endoderm genes indicate cultures are beyond gastrulation stage at the time of sorting, since T (brachyury) and goosecoid (Gsc) transcripts are nearly absent by EB7+21, whereas Foxa2 and Sox17 remain highly expressed. Pdx1 transcripts are also more abundant in post-EB cultures. *, p ≤ 0.05
Fig 2
Fig 2
Isolation of EpCAM+SSEA1SSEA3 cells from mass differentiated ESC cultures by MACS sorting results in highly enriched EpCAM+ population diminished in undifferentiated ESC and extraembryonic endoderm transcripts. (a) Flow diagram of three-step sorting strategy. In the first sort, SSEA1 antibody removes undifferentiated ESCs expressing SSEA1; next, extra-embryonic endoderm is depleted using SSEA3 antibody. A third sort selects for remaining EpCAM+ cells. (b) FACS analysis of MACS-sorted cells indicates a nearly homogeneous population (96%) of EpCAM+ cells from an initial population that is approximately 50% EpCAM+. (c) Transcript levels of Oct4, indicative of undifferentiated ESCs, decline gradually during in vitro differentiation and are further significantly reduced by MACS sorting. *, p ≤ 0.05. (d) SSEA4, indicative of extraembryonic endoderm, was found on a subset of cells in unsorted EB7+13 cultures, but not on similar stage cells sorted to select the EpCAM+SSEA1SSEA3 population and then cultured for two days. Scale bar, 50 μm.
Fig 3
Fig 3
Tumorigenicity of EpCAM+ SSEA1SSEA3cells. (a) ESCs were differentiated to the EB7+21 stage, selected for EpCAM+SSEA1SSEA3 cells according to the strategy in Fig 2a, and then sorted cells were immediately injected into subcutaneous (SC) sites in immunodeficient NOD/SCID mice and allowed to remain for 6–24 weeks. Photograph shows a representative mouse in which the unsorted, differentiated population grew into a teratoma by 6 weeks, but the sorted cell population did not. (b) Bar graph indicating the percent of inocula forming tumors at 6 weeks (or up to 24 weeks for EpCAM+ sorted cells) after SC transplantation of 106 cells of either undifferentiated ESCs, sorted EpCAM+ cells, sorted EpCAM cells, or unsorted cells previously differentiated to the EB7+21 stage (Unsorted EB7+21) into recipient mice. Sorted EpCAM+ vs. Undifferentiated ESC, p<0.0001; Sorted EpCAM+ vs. Unsorted EB7+21, p<0.0001; Sorted EpCAM+ vs. Sorted EpCAM, p= 0.0549; Sorted EpCAM vs. Undifferentiated ESC, p<0.0008; Sorted EpCAM vs. Unsorted EB7+21, p= 0.0152; Undifferentiated ESC vs. unsorted EB7+21, p= 0.44; overall, p<0.0001. (c) Kaplan-Meier curve indicating the proportion of animals free of tumors, defined as presence of a nodule 3 mm or larger in diameter, at various times after transplantation of 1 × 10⁶ cells SC. Sorted EpCAM+ vs. Undifferentiated ESC, p< 0.0001; Sorted EpCAM+ vs. Unsorted EB7+21, p<0.0001; Sorted EpCAM+ vs. sorted EpCAM, p= 0.0117; Sorted EpCAM vs. Undifferentiated ESC, p<0.0001; Sorted EpCAM vs. Unsorted EB7+21, p= 0.0091; Undifferentiated ESC vs. unsorted EB7+21, p= 0.0025; overall p<0.0001. N differs between (b) and (c) in two categories because some animals did not have their injection sites measured serially.
Fig 4
Fig 4
Analysis of sorted cells. (a) FACS determination of the percentage PDX1+ cells in presort and post-sort populations in 4 independent experiments. (b) FACS dot plots of data from experiment 1 (Fig 4a) showing co-expression of PDX1 and EpCAM in pre-and post-sorted cells, demonstrating efficient recovery of PDX1+ cells in the EpCAM+ sorted population. (c) Levels of gene transcripts characteristic of different embryonic germ layers and ESCs in sorted cells compared to unsorted cells, showing enrichment of endoderm markers relative to markers of other germ layers. *, p ≤ 0.05. (d) Phase contrast image of cells 24 hours after sorting (upper), or confluent cultures 4 days after sorting (lower), grown in medium containing 10% SR and FGF10 50 ng/ml. (e) Cells at 4 days post-sorting virtually all co-stain for Sox17 and Foxa2, consistent with a culture composed solely of definitive endoderm cells. Scale bars, 100 μm (d), 50 μm (e).
Fig 5
Fig 5
Differentiation of sorted EpCAM+ cells in vitro. (a) Differentiation scheme: sorted cells were grown to confluency in medium containing 10% Serum Replacement (SR) and FGF10, then coated with Matrigel and switched to serum free differentiation medium (SFDM) containing ITS (SFDM/ITS) FGF10, Nicotinamide, and Exendin 4 for 8–10 days (see Materials and Methods for details and doses). They were then grown for 7 additional days in SFDM as above except that B27 was substituted for ITS (SFDM/B27) and HGF and BTC were added. (b) Phase contrast image of cells beginning to aggregate 24 hours after Matrigel addition. (c) Phase contrast image of cultures 3 days after Matrigel addition, showing formation of tubular/cystic structures. (d) Numerous cystic structures (outlined in white stippling) developed after 8–10 days in SFDM. (inset) H&E stained tissue section of structures at 10 days in SFDM medium, primarily composed of simple cuboidal epithelium. (e) Cells incorporated into tubules are strongly EPCAM+. (f) Cystic structures, observed as a hollow ball in a single confocal slice (inset shows stacked image), are entirely PDX1+ and (g) EpCAM+ after 10 days in SFDM. Three-dimensional structures express pancreatic progenitor proteins after 8 days of differentiation in SFDM including (h) Hnf4α, (i) Hnf6, (j) Prox1 and (k) Sox9. Scale bars, 100 μm (b,c,d), 50 μm (d inset, e–k). (l) Gene transcript levels of sorted cells after differentiation in SFDM for 8 days compared to freshly-sorted cells demonstrate stable expression of pancreatic endoderm markers and an increase in Pdx1, Pax4 and Nkx2.2 transcripts. Pax4 was undetected in post-sort d0 cells; a Ct value of 40 was used in calculating the fold change.
Fig 6
Fig 6
In vivo differentiation of EpCAM+ cells. Freshly-sorted cells were injected SC into NOD/SCID mice and resulting growths were examined by histological staining, immunohistochemistry, and QPCR. (a) H&E stained tissue section of typical teratoma formed after transplantation of either ESCs, unsorted differentiated EB7+21 cells, or sorted EpCAM cells. (b) H&E stained tissue section of a 1mm nodule formed after transplantation of EpCAM+ cells, composed of numerous cystic/glandular structures. (c) Higher magnification of area in 6b, showing simple cuboidal epithelium lined cysts. (d) Mucicarmine staining of a similar section, showing stained intracellular vacuoles (arrow) indicating mucin containing goblet cells such as those found in intestine, bronchial or pancreatico-biliary ductal cells. (e, f) Immunohistochemical analysis of two different nodules derived from inoculation of EpCAM+ cells reveals that virtually all EpCAM+ (green) epithelial cells lining the cysts co-stain for PDX1 (red). (g) Immunohistochemical staining of embryonic day 13.5 mouse pancreas sections illustrates the similarity of normal embryonic pancreatic tissue to the cystic/glandular structures derived from EpCAM+ cells, with corresponding co-staining of PDX1 (red) and EpCAM (green) in most cells. Scale bars, 500 μm (a), 200 μm (b), 50 μm (c–g). (h) Gene transcript levels of five individual primary nodules formed after SC injection of EpCAM+ cells. All nodules contain high levels (low ΔCt) of PDX1 and YY transcripts, signature genes for posterior foregut cells, and are highly enriched above post sort levels. (i) Fold change of transcript expression of all nodules relative to the mean. 19.00 was used as the Ct cutoff value. Nodule 2 did not yield enough material for analysis of all genes.
Fig 7
Fig 7
Analysis of cells derived from an EpCAM+ primary nodule. (a) Phase contrast image of cells that grew out of nodule. Nodule was removed 23 weeks after sorted EpCAM+ cells were inoculated into immunodeficient mice, minced and plated onto irradiated fibroblasts. Cells resemble undifferentiated ESCs in morphology (inset), but the growth pattern differs in that they tend to form lacunae in the center of spread-out colonies and do not multilayer. (b) Immunohistochemical analysis demonstrated cells are PDX1+ and Oct4, unlike ESCs. Cells also stained for other endoderm markers including Hnf4α (c), ductal cytokeratins K19 and K7 (d), and Foxa2/Sox17 (e). (f) Transcript analysis of ESC, neural, mesoderm and endoderm-restricted genes shows that compared to ESCs, the expression of pluripotency genes (Oct4, Sox2, Nanog) is significantly decreased whereas the expression of foregut endoderm-restricted genes (Pdx1, Cdx2,) is enhanced. As expected, Sox17 and Foxa2 transcripts are expressed at higher levels than in ESCs. The expression of neural (Sox1), mesoderm (Nkx2.5, Meox1), primitive streak (T, Gsc) and hindgut genes (Hoxc4, Hoxb13, Cdx1) are either not detected or show reduced expression in these cells compared to ESCs. Liver markers (Afp, Tat) are also more abundantly expressed in these cells than in ESCs, consistent with being a posterior foregut-restricted cell population. (g) QPCR analysis of EpCAM+ primary nodule-derived cells, or candidate FGSCs, of a panel of genes whose expression characterizes various stages of pancreas development Transcript levels of the highest transcribed genes are presented; other genes were less abundant or not detected. (h) Immunohistochemical analysis of small secondary nodule derived from candidate foregut stem cells that had been inoculated into immunodeficient mice shows re-establishment of the cystic/glandular structures which co-stained for PDX1 and EpCAM, similar to the parent or primary nodule. (i) Secondary EpCAM+ cysts express the H2kb haplotype of the injected cells. Host NOD/SCID mice are H2Kd. Scale bars, 50 μm (a–e) and 100 μm (h, i).

References

    1. Alper J. Geron gets green light for human trial of ES cell-derived product. Nat Biotechnol. 2009;27:213–214. - PubMed
    1. Amariglio N, Hirshberg A, Scheithauer BW, Cohen Y, Loewenthal R, Trakhtenbrot L, Paz N, Koren-Michowitz M, Waldman D, Leider-Trejo L, Toren A, Constantini S, Rechavi G. Donor-derived brain tumor following neural stem cell transplantation in an ataxia telangiectasia patient. PLoS Med. 2009;6:e1000029. - PMC - PubMed
    1. Fujikawa T, Oh SH, Pi L, Hatch HM, Shupe T, Petersen BE. Teratoma formation leads to failure of treatment for type I diabetes using embryonic stem cell-derived insulin-producing cells. Am J Pathol. 2005;166:1781–1791. - PMC - PubMed
    1. Ishii T, Yasuchika K, Machimoto T, Kamo N, Komori J, Konishi S, Suemori H, Nakatsuji N, Saito M, Kohno K, Uemoto S, Ikai I. Transplantation of embryonic stem cell-derived endodermal cells into mice with induced lethal liver damage. Stem Cells. 2007;25:3252–3260. - PubMed
    1. Kroon E, Martinson LA, Kadoya K, Bang AG, Kelly OG, Eliazer S, Young H, Richardson M, Smart NG, Cunningham J, Agulnick AD, D’Amour KA, Carpenter MK, Baetge EE. Pancreatic endoderm derived from human embryonic stem cells generates glucose-responsive insulin-secreting cells in vivo. Nat Biotechnol. 2008;26:443–452. - PubMed

Publication types

MeSH terms

Substances