

Elevated mitochondrial superoxide disrupts normal T cell development, impairing adaptive immune responses to an influenza challenge
- PMID: 21130157
- PMCID: PMC3026081
- DOI: 10.1016/j.freeradbiomed.2010.11.025
Elevated mitochondrial superoxide disrupts normal T cell development, impairing adaptive immune responses to an influenza challenge
Abstract
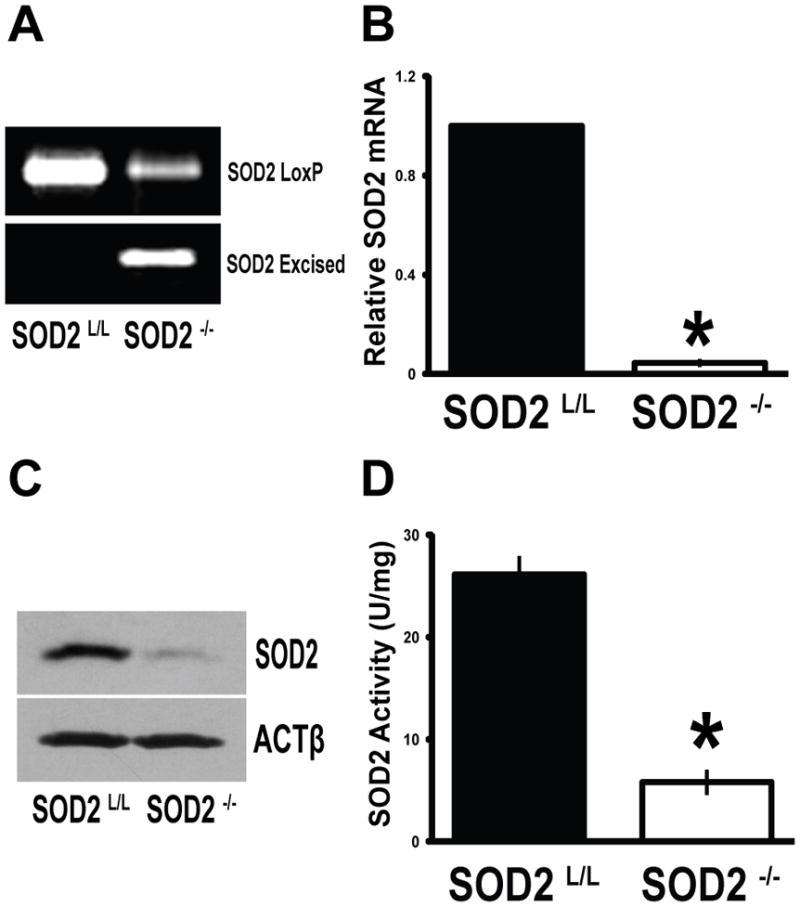
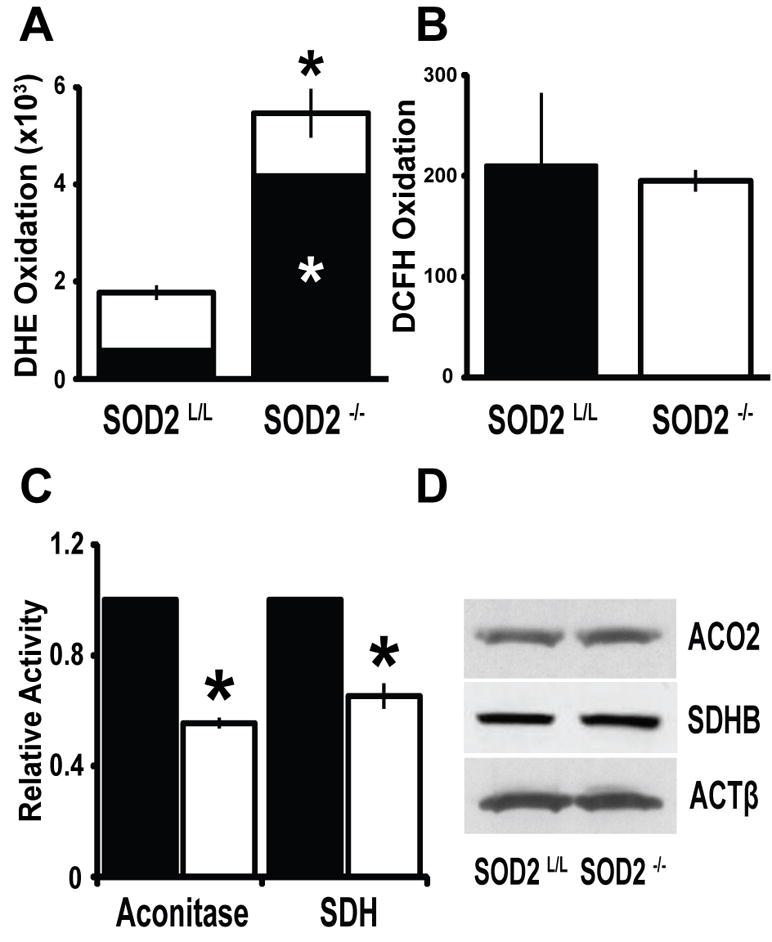
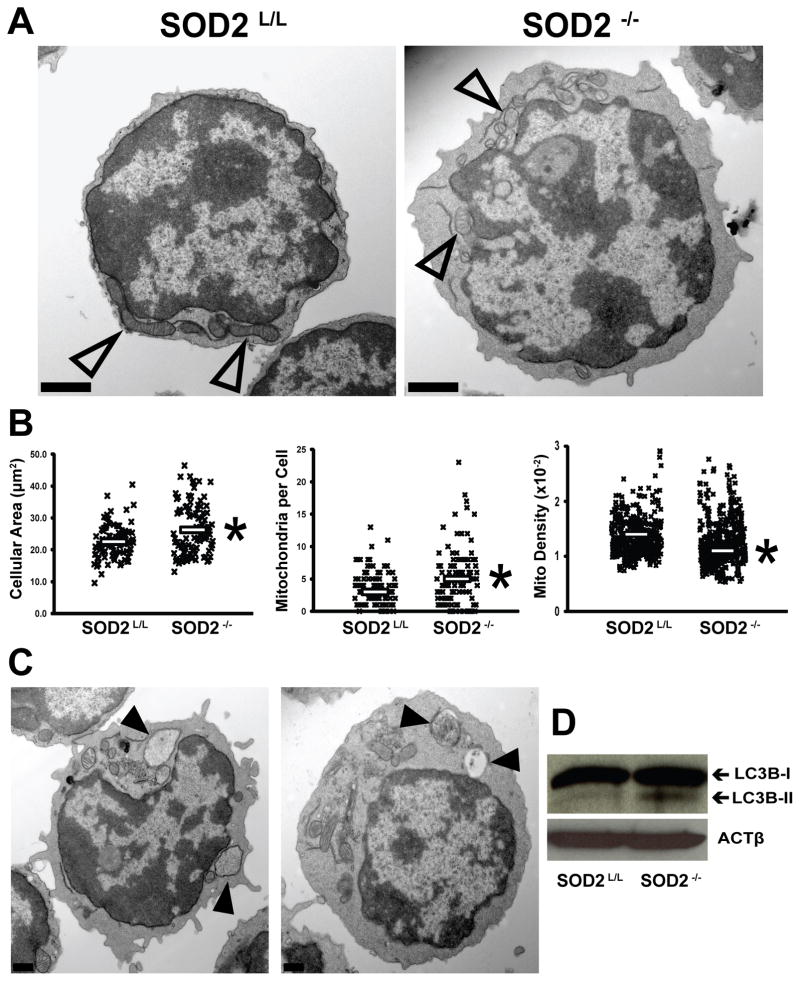
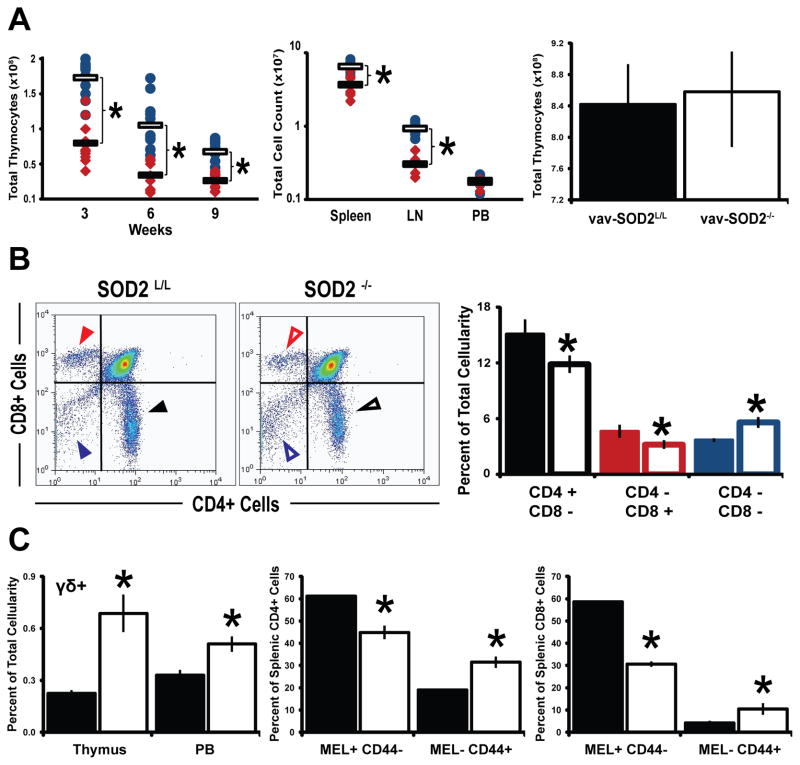
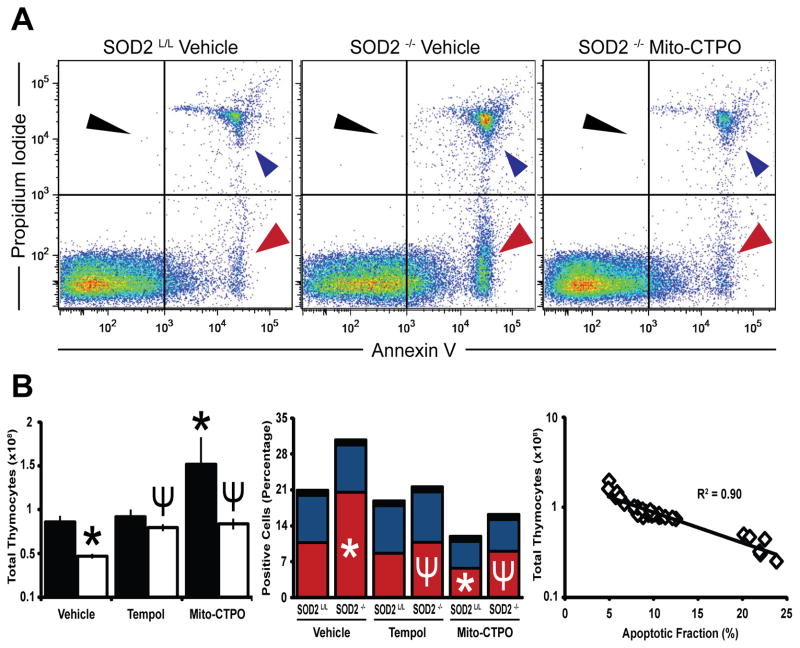
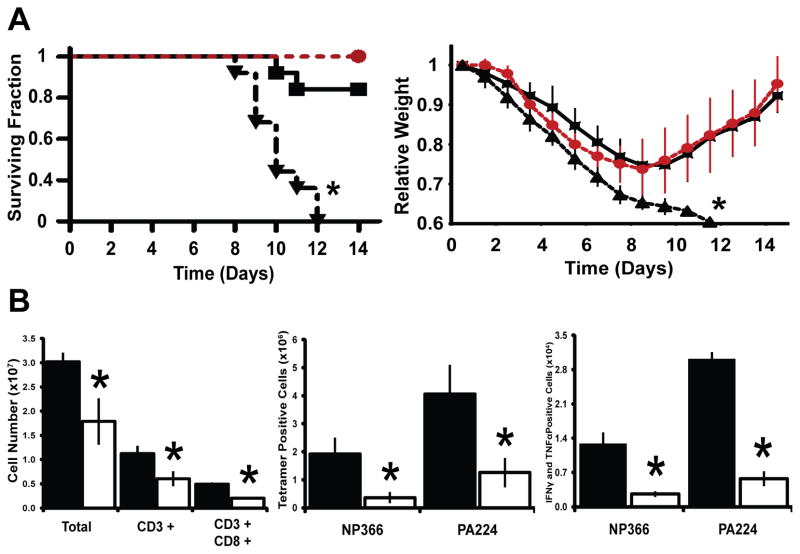
Reactive oxygen species (ROS) are critical in a broad spectrum of cellular processes including signaling, tumor progression, and innate immunity. The essential nature of ROS signaling in the immune systems of Drosophila and zebrafish has been demonstrated; however, the role of ROS, if any, in mammalian adaptive immune system development and function remains unknown. This work provides the first clear demonstration that thymus-specific elevation of mitochondrial superoxide (O(2)(•-)) disrupts normal T cell development and impairs the function of the mammalian adaptive immune system. To assess the effect of elevated mitochondrial superoxide in the developing thymus, we used a T-cell-specific knockout of manganese superoxide dismutase (i.e., SOD2) and have thus established a murine model to examine the role of mitochondrial superoxide in T cell development. Conditional loss of SOD2 led to increased superoxide, apoptosis, and developmental defects in the T cell population, resulting in immunodeficiency and susceptibility to the influenza A virus H1N1. This phenotype was rescued with mitochondrially targeted superoxide-scavenging drugs. These findings demonstrate that loss of regulated levels of mitochondrial superoxide lead to aberrant T cell development and function, and further suggest that manipulations of mitochondrial superoxide levels may significantly alter clinical outcomes resulting from viral infection.
Copyright © 2010 Elsevier Inc. All rights reserved.
Conflict of interest statement
The authors have no conflicts of interest to disclose on this research project
Figures
Similar articles
-
Mitochondrial superoxide disrupts the metabolic and epigenetic landscape of CD4+ and CD8+ T-lymphocytes.Redox Biol. 2019 Oct;27:101141. doi: 10.1016/j.redox.2019.101141. Epub 2019 Feb 21. Redox Biol. 2019. PMID: 30819616 Free PMC article.
-
Neutralization of mitochondrial superoxide by superoxide dismutase 2 promotes bacterial clearance and regulates phagocyte numbers in zebrafish.Infect Immun. 2015 Jan;83(1):430-40. doi: 10.1128/IAI.02245-14. Epub 2014 Nov 10. Infect Immun. 2015. PMID: 25385799 Free PMC article.
-
Nucleotide oligomerization and binding domain 2-dependent dendritic cell activation is necessary for innate immunity and optimal CD8+ T Cell responses to influenza A virus infection.J Virol. 2014 Aug;88(16):8946-55. doi: 10.1128/JVI.01110-14. Epub 2014 May 28. J Virol. 2014. PMID: 24872587 Free PMC article.
-
Managing odds in stem cells: insights into the role of mitochondrial antioxidant enzyme MnSOD.Free Radic Res. 2016;50(5):570-84. doi: 10.3109/10715762.2016.1155708. Free Radic Res. 2016. PMID: 26899340 Review.
-
SOD2-deficiency sideroblastic anemia and red blood cell oxidative stress.Antioxid Redox Signal. 2006 Jul-Aug;8(7-8):1217-25. doi: 10.1089/ars.2006.8.1217. Antioxid Redox Signal. 2006. PMID: 16910769 Review.
Cited by
-
Reactive Oxygen Species Regulate T Cell Immune Response in the Tumor Microenvironment.Oxid Med Cell Longev. 2016;2016:1580967. doi: 10.1155/2016/1580967. Epub 2016 Jul 28. Oxid Med Cell Longev. 2016. PMID: 27547291 Free PMC article. Review.
-
Regulation of SOD2 in cancer by histone modifications and CpG methylation: closing the loop between redox biology and epigenetics.Antioxid Redox Signal. 2013 May 20;18(15):1946-55. doi: 10.1089/ars.2012.4850. Epub 2012 Oct 18. Antioxid Redox Signal. 2013. PMID: 22946823 Free PMC article. Review.
-
Influence of Inflammation in the Process of T Lymphocyte Differentiation: Proliferative, Metabolic, and Oxidative Changes.Front Immunol. 2018 Mar 1;9:339. doi: 10.3389/fimmu.2018.00339. eCollection 2018. Front Immunol. 2018. PMID: 29545794 Free PMC article. Review.
-
Absence of manganese superoxide dismutase delays p53-induced tumor formation.Redox Biol. 2014 Jan 13;2:220-3. doi: 10.1016/j.redox.2014.01.001. eCollection 2014. Redox Biol. 2014. PMID: 24494196 Free PMC article.
-
MicroRNAs hsa-miR-99b, hsa-miR-330, hsa-miR-126 and hsa-miR-30c: Potential Diagnostic Biomarkers in Natural Killer (NK) Cells of Patients with Chronic Fatigue Syndrome (CFS)/ Myalgic Encephalomyelitis (ME).PLoS One. 2016 Mar 11;11(3):e0150904. doi: 10.1371/journal.pone.0150904. eCollection 2016. PLoS One. 2016. PMID: 26967895 Free PMC article.
References
-
- McCord JM, Fridovich I. The biology and pathology of oxygen radicals. Ann Intern Med. 1978;89:122–127. - PubMed
-
- Cerutti PA. Prooxidant states and tumor promotion. Science. 1985;227:375–381. - PubMed
-
- Fridovich I. Oxygen toxicity: a radical explanation. J Exp Biol. 1998;201:1203–1209. - PubMed
-
- Leibovitz BE, Siegel BV. Aspects of free radical reactions in biological systems: aging. J Gerontol. 1980;35:45–56. - PubMed
Publication types
MeSH terms
Substances
Grants and funding
LinkOut - more resources
Full Text Sources
Other Literature Sources
Molecular Biology Databases
