. 2011 Apr;29(3):324-34.
doi: 10.1016/j.mri.2010.09.004. Epub 2010 Dec 3.

Quantitative MRI using T1ρ and T2 in human osteoarthritic cartilage specimens: correlation with biochemical measurements and histology

Affiliations

Quantitative MRI using T1ρ and T2 in human osteoarthritic cartilage specimens: correlation with biochemical measurements and histology

Xiaojuan Li et al. Magn Reson Imaging. 2011 Apr.

Abstract

Purpose: A direct correlation between T(1ρ), T(2) and quantified proteoglycan and collagen contents in human osteoarthritic cartilage has yet to be documented. We aimed to investigate the orientation effect on T(1ρ) and T(2) values in human osteoarthritic cartilage and to quantify the correlation between T(1ρ), T(2) vs. biochemical composition and histology in human osteoarthritic cartilage.

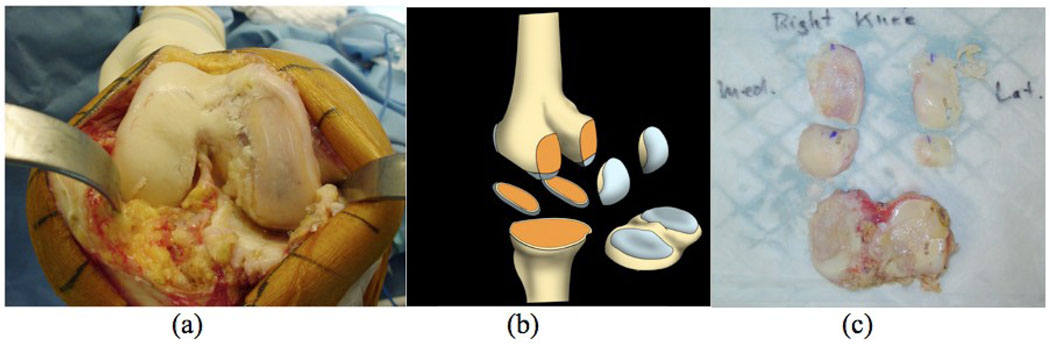
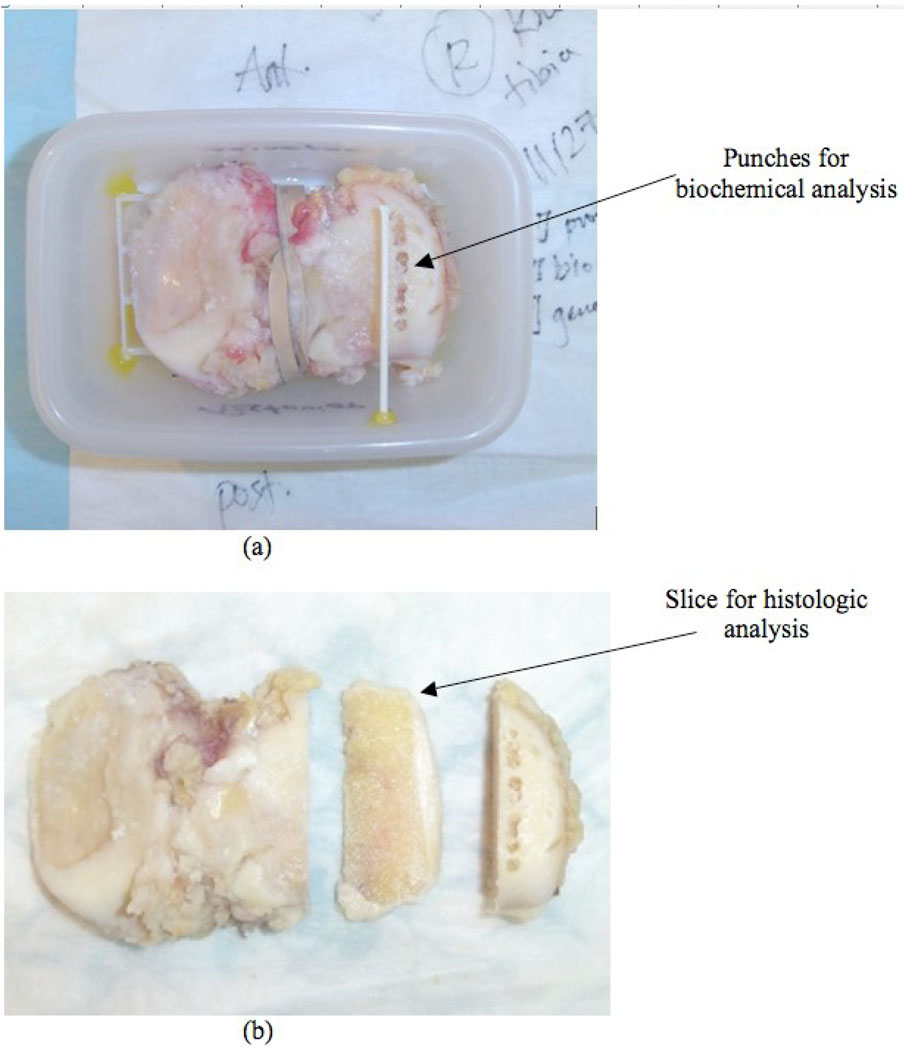
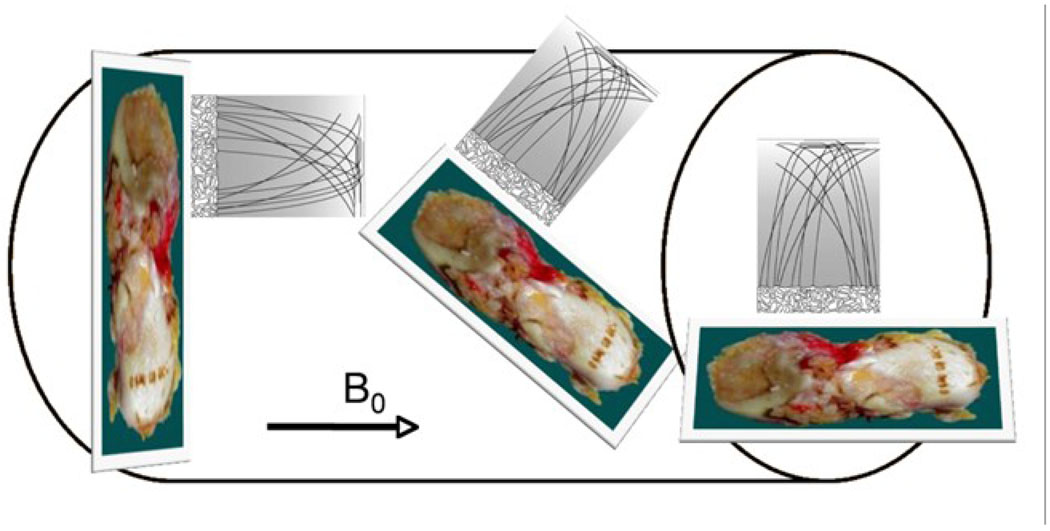
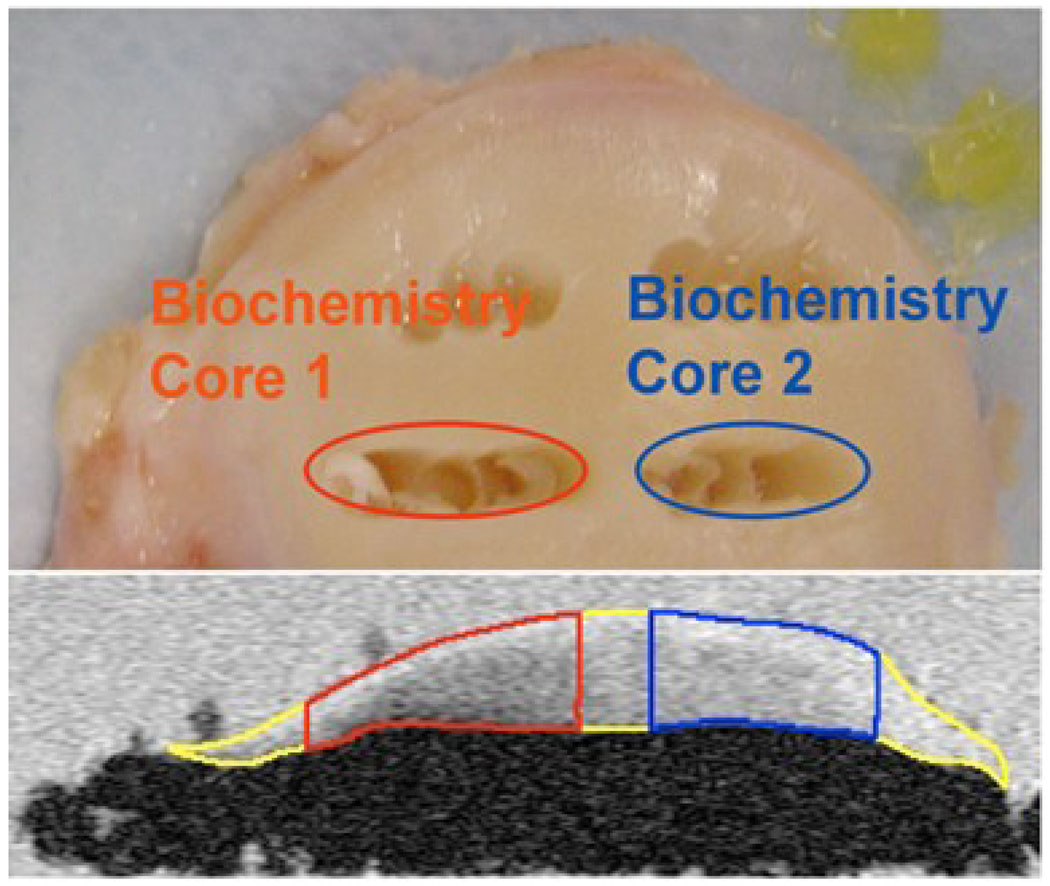
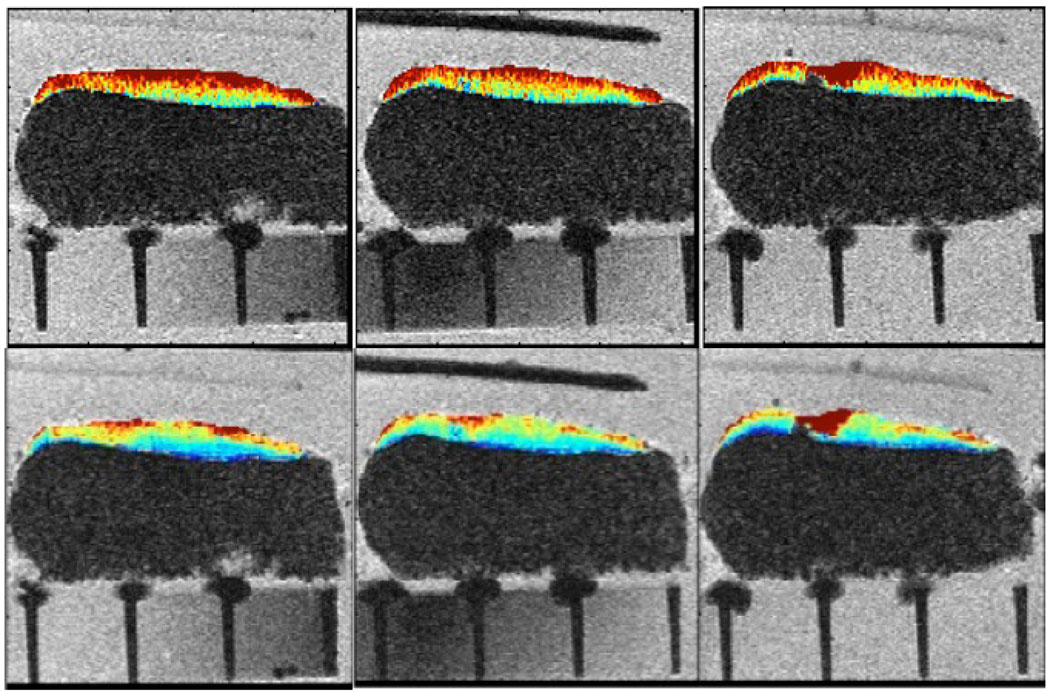
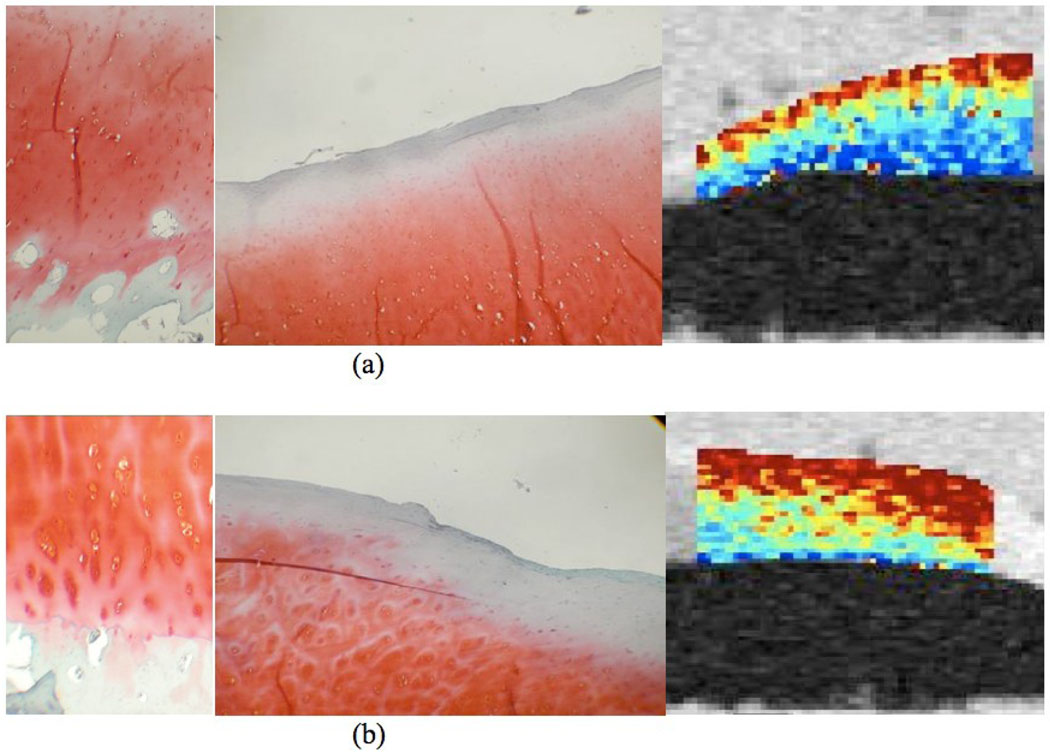
Materials and methods: Thirty-three cartilage specimens were collected from patients who underwent total knee arthroplasty due to severe osteoarthritis and scanned with a 3T MR scanner for T(1ρ) and T(2) quantification. Nine specimens were scanned at three different orientations with respect to the B(0): 0°, 90° and 54.7°. Core punches were taken after MRI. Collagen and proteoglycan contents were quantified using biochemical assays. Histology sections were graded using Mankin scores. The correlation between imaging parameters, biochemical contents and histological scores were studied.

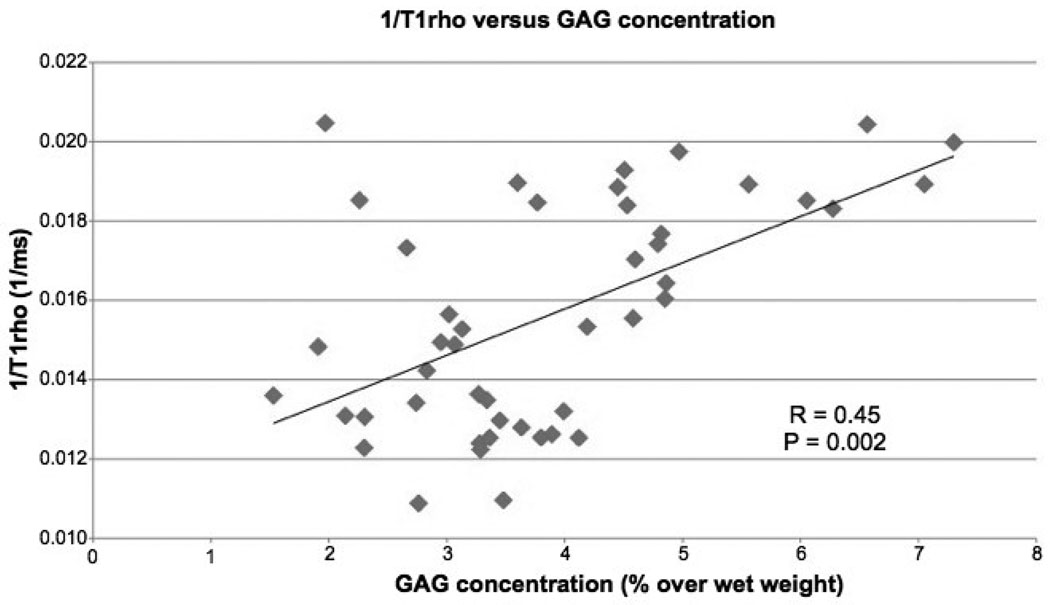
Results: Both mean T(1ρ) and T(2) at 54.7° were significantly higher than those measured at 90° and 0°, with T(1ρ) showing less increase compared to T(2). R(1ρ) (1/T(1ρ)) values had a significant but moderate correlation with proteoglycan contents (R=.45, P=.002), while R(2) (1/T(2)) was not correlated with proteoglycan. No significant correlation was found between relaxation times (T(1ρ) or T(2)) and collagen contents. The T(1ρ) values of specimen sections with high Mankin scores were significantly higher than those with low Mankin scores (P<.05).

Conclusions: Quantitative MRI has a great potential to provide noninvasive imaging biomarkers for cartilage degeneration in osteoarthritis.


Figures

Figure 1
Figure 1
Cartilage specimen collection from patients with severe osteoarthritis who underwent total knee arthroplasty. (a) The open knee of a patient during TKA showing severe cartilage degeneration especially in medial side of the knee; (b) diagram of five specimens containing cartilage and bone sectioned during normal TKA: lateral/medial inferior femoral condyle (LIFC and MIFC), lateral/medial posterior femoral condyle (LPFC and MPFC), tibial plateau (containing lateral and medical tibia, LT and MT); (c) Five pieces of specimens from the patient in (a). Blue ink marked the anterior end of tibial plateau and LIFC/MIFC, and inferior end of LPFC and MPFC.
Figure 2
Figure 2
Specimen preparation. The specimen was mounted on a plastic grid for location reference, and then placed and glued into a plastic container and immersed in phosphate-buffered saline (PBS) for ex vivo MRI (a). An additional thin plastic tube marker was placed on top of the location where the histology slice was obtained after the MRI. After MRI, punches were taken for biochemical analysis (a) and a 3mm histology slice was cut next to the biochemical punches for histological analysis (b).
Figure 3
Figure 3
Diagram of cartilage specimens ex vivo MRI with different orientations in the MR scanner. Specimens were scanned at three different orientations with respect to the B0: 0° (left), 54.7° (center) and 90° (right).
Figure 4
Figure 4
The locations of the punches for biochemical analysis (top) were identified in SPGR images (bottom) based on anatomical distances and landmarks, and confirmed with reference location from the plastic grid.
Figure 5
Figure 5
Three consecutive sections of ex vivo MRI with color-coded T (top) and T2 (bottom) maps. The plastic tube indicates the center slice that was cut for histological analysis after ex vivo MRI.
Figure 6
Figure 6
Significant correlation was found between R (1/T) and GAG contents in human osteoarthritic cartilage.
Figure 7
Figure 7
Histology slides and T maps from a lateral tibial plateau specimen. (a) The anterior section received a low overall Mankin score of 2, because of the presence of mild surface irregularities and the infiltration of blood vessel across the tidemark (left). The Safranin-O staining shows no detectable loss (center), corresponding to a score of 0. The adjacent biochemistry core in the anterior has a relatively high GAG concentration of 4.97%. T agrees well with the histology and biochemistry findings, the region has a relatively low T value of 50.6 ± 31.3 ms (right); (b) The posterior section of the lateral tibial plateau received a higher overall Mankin score of 5, due to surface irregularities, pannus, cell cloning, and loss of safranin-O staining (left). The Safrain-O score was 1 due to focal loss of Safranin-O staining (center). The adjacent biochemistry core in the posterior has a relatively lower GAG concentration of 3.45%. T agrees well with these findings, and the posterior region has a relatively high T value of 77.1 ± 35.8 ms (right).

References

    1. Brandt KD, Doherty M, Lohmander LS, editors. Osteoarthritis. New York: Oxford University Press Inc; 1998.
    1. Martin JA, Buckwalter JA. Roles of articular cartilage aging and chondrocyte senescence in the pathogenesis of osteoarthritis. Iowa Orthop J. 2001;21:1–7. - PMC - PubMed
    1. Verstraete KL, Almqvist F, Verdonk P, Vanderschueren G, Huysse W, Verdonk R, Verbrugge G. Magnetic resonance imaging of cartilage and cartilage repair. Clin Radiol. 2004;59:674–689. - PubMed
    1. Mosher TJ, Dardzinski BJ, Smith MB. Human articular cartilage: influence of aging and early symptomatic degeneration on the spatial variation of T2--preliminary findings at 3 T. Radiology. 2000;214:259–266. - PubMed
    1. Dunn TC, Lu Y, Jin H, Ries MD, Majumdar S. T2 relaxation time of cartilage at MR imaging: comparison with severity of knee osteoarthritis. Radiology. 2004;232:592–598. - PMC - PubMed

Publication types