. 2011 Mar;232(1-2):108-18.
doi: 10.1016/j.jneuroim.2010.10.018. Epub 2010 Dec 4.

The kinase inhibitory region of SOCS-1 is sufficient to inhibit T-helper 17 and other immune functions in experimental allergic encephalomyelitis

Affiliations

The kinase inhibitory region of SOCS-1 is sufficient to inhibit T-helper 17 and other immune functions in experimental allergic encephalomyelitis

Lindsey D Jager et al. J Neuroimmunol. 2011 Mar.

Abstract

Suppressors of cytokine signaling (SOCS) negatively regulate the immune response, primarily by interfering with the JAK/STAT pathway. We have developed a small peptide corresponding to the kinase inhibitory region (KIR) sequence of SOCS-1, SOCS1-KIR, which inhibits kinase activity by binding to the activation loop of tyrosine kinases such as JAK2 and TYK2. Treatment of SJL/J mice with SOCS1-KIR beginning 12 days post-immunization with myelin basic protein (MBP) resulted in minimal symptoms of EAE, while most control treated mice developed paraplegia. SOCS1-KIR treatment suppressed interleukin-17A (IL-17A) production by MBP-specific lymphocytes, as well as MBP-induced lymphocyte proliferation. When treated with IL-23, a key cytokine in the terminal differentiation of IL-17-producing cells, MBP-sensitized cells produced IL-17A and IFNγ; SOCS1-KIR was able to inhibit the production of these cytokines. SOCS1-KIR also blocked IL-23 and IL-17A activation of STAT3. There is a deficiency of SOCS-1 and SOCS-3 mRNA expression in CD4(+) T cells that infiltrate the CNS, reflecting a deficiency in regulation. Consistent with therapeutic efficacy, SOCS1-KIR reversed the cellular infiltration of the CNS that is associated with EAE. We have shown here that a SOCS-1 like effect can be obtained with a small functional region of the SOCS-1 protein that is easily produced.


Conflict of interest statement

The authors have no financial conflict of interest.

Figures

Figure 1
Figure 1. SOCS1-KIR protects mice from relapsing/remitting EAE
SJL/J mice were injected i.p. with PBS, SOCS1-KIR (60 μg/mouse), or SOCS1-KIR2A (60 μg/mouse) every other day starting 12 days post-immunization with MBP for EAE induction, after lymphocyte infiltration of the CNS. Mice were followed daily for signs of EAE, and the mean daily severity of disease was graded based upon the following scale: 0, no disease; 1, loss of tail tone; 2, hind leg weakness; 3, paraparesis; 4, paraplegia; 5, moribund; and 6, death. PBS-treated mice had a maximum average disease severity of 4.2, SOCS1-KIR2A-treated mice a maximum average disease severity of 3.4, and SOCS1-KIR-treated mice a maximum average disease severity of 1.8. All mice in the control groups had disease (disease incidence 20 of 20 for PBS-treated mice and 15 of 15 for SOCS1-KIR2Atreated mice) whereas 3 mice in the SOCS1-KIR treated group had no disease (disease incidence 12 of 15) and 8 out of 15 experienced only Stage 1 or less. Statistics were performed using an unpaired Student’s t test.
Figure 2
Figure 2. IL-17A production by splenocytes is inhibited in EAE by treatment with SOCS1- KIR
A) Splenocytes were isolated from SJL/J mice 36 days after immunization with MBP. Prior to harvesting the spleens, the mice had been receiving i.p. injections of 100 μL PBS, SOCS1-KIR (60 μg/mouse), or SOCS1-KIR2A (60 μg/mouse) every other day beginning on day 12 post-immunization, and were scored EAE stage 1. Cells were seeded at 5 × 10⁶ cells/well in RPMI (10% FBS) and incubated 24 hours at 37°C, 5%CO2. Supernatants were collected and analyzed for IL-17A using the IL-17A Ready-Set-Go ELISA kit (eBioscience, San Diego, CA). B) IL-17A production by splenocytes in response to MBP stimulation is inhibited in mice treated with SOCS1-KIR. Splenocytes were isolated from SJL/J mice 27 days after immunization with MBP. Prior to harvesting the spleens, the mice had been treated as described in part A. Cells were seeded as described above and treated with or without 25 μg/ml MBP and incubated 24 hours. Supernatants were collected and analyzed for IL-17A as in part A. *P < 0.001. C) IL-17A production by splenocytes is inhibited by SOCS1-KIR. Splenocytes were isolated from SJL/J mice 36 days after immunization with MBP. Prior to harvesting the spleens, the mice were scored at EAE stage 1. Cells were seeded as described and peptides were added at the above concentration. After 2 hours, MBP (50 μg/ml) was added to each well and the cells were incubated an additional 24 hours. Supernatants were collected and analyzed for IL-17A as in part A. *P < 0.01, **P < 0.0001. Statistics were performed using two-way ANOVA. The data are representative of three separate experiments
Figure 3
Figure 3. SOCS1-KIR inhibits MBP-induced proliferation of splenocytes
Spleens were harvested from MBP-immunized SJL/J mice, EAE stage 1(5 weeks after immunization), and cells were seeded at 5 × 10⁶ cells/well in RPMI (10% FBS) in a 96-well plate. Peptides were added at the above concentrations and cells were incubated at 37°C, 5% CO2, for 2 hours. MBP (50 μg/ml) was then added to each well and cells were incubated for 72 hours before proliferation was assessed using the CellTiter 96 AQueous One Cell Proliferation Assay (Promega, Madison, WI). *P < 0.05 as determined by two-way ANOVA. The data are representative of three separate experiments.
Figure 4
Figure 4. SOCS1-KIR prevents and reverses lymphocyte infiltration of the CNS during EAE
A) Brain from an untreated mouse 12 days post-immunization with MBP. B) Brain from a naïve mouse. SJL/J mice were injected with (C) PBS, (D) SOCS1-KIR (60 μg/mouse), or (E) SOCS1- KIR2A (60 μg/mouse) every other day beginning 12 days post-immunization with MBP and their brains were collected on day 38 post-immunization. Mice were sacrificed, their brains were collected in 4% PFA in PBS and fixed overnight before being transferred to 70% ethanol. Brains were embedded in paraffin, cut, and stained with H&E. Magnification is 1.25 x; each inset is 20 x.
Figure 5
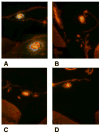
Figure 5. SOCS1-KIR enters the blood brain barrier endothelial cells of EAE mice but not healthy controls
MBP-sensitized mice at EAE stage 1 (5 weeks after immunization) were injected i.p. with 1 ml (A) FITC-SOCS1-KIR (50 μg/ml) or (B) equivalent FITC alone. After 2 hours, brains were collected in 4% PFA in PBS and fixed overnight before being transferred to 70% ethanol. Brains were then paraffin-embedded, sliced, and sections were dried in the dark for 24 hours. Naïve mice were treated with (C) FITC-SOCS1-KIR or (D) FITC alone and the brains were processed as described. Green = FITC-SOCS1-KIR or FITC. Orange = autofluorescence, mainly due to red blood cells. Magnification is 20 x; inset for A is 40 x.
Figure 6
Figure 6. Expression of SOCS-1 and SOCS-3 mRNA in CD4+ T cells of the spleen and CNS of naïve and EAE mice
Spleens and brains were collected from naïve and MBP-sensitized SJL/J mice experiencing EAE at Stage 1 (5 weeks after immunization). Monocytes were isolated from the CNS tissues using a Percoll gradient. CD4+ T cells were isolated from single cell suspensions using the CD4+ T cell isolation kit (Miltenyi Biotec). No CD4+ T cells were isolated from the naïve CNS tissue. Samples labeled “nonCD4 cells” refer to cells collected from the column after the CD4+ T cell fraction was collected. Expression of SOCS-1 and SOCS-3 mRNA was normalized to GAPDH mRNA expression and data are shown as fold expression relative to that of the naïve spleen CD4+ T cells.
Figure 7
Figure 7. Induction of IL-17A and IFNã in MBP-sensitized splenocytes by IL-23 is inhibited by SOCS1-KIR
A) IL-17A production by splenocytes in response to IL-23 is inhibited by SOCS1- KIR. Splenocytes were isolated from SJL/J mice 37 days after immunization with MBP. Prior to harvesting the spleen, the mouse was scored at EAE stage one. Cells were seeded at 5 × 10⁶ cells/well in RPMI (10% FBS) in a 96-well plate. Peptides were added at the above concentrations and cells were incubated at 37°C, 5% CO2, for 2 hours. IL-23 (10 ng/ml) was added to each well and the cells were incubated an additional 48 hours. Supernatants were collected and analyzed for IL-17A production using the IL-17A Ready-Set-Go ELISA kit (eBioscience, San Diego, CA). *P < 0.05. B) IFNγ production by splenocytes in response to IL-23 is inhibited by SOCS1-KIR. Splenocytes were harvested and treated as described for part A. Supernatants were collected and analyzed for IFNγ production using the IFNγ Ready-Set-Go ELISA kit (eBioscience, San Diego, CA). *P < 0.05. Statistics were determined by two-way ANOVA. The data are representative of three separate experiments.
Figure 8
Figure 8. SOCS1-KIR inhibits the production of IFNã by CD4+ and CD8+ T cells
A) CD4+ T cells were isolated from the spleens of MBP-immunized mice (4 to 5 weeks after immunization), and incubated with the indicated peptides, inactivated APCs, and MBP before being transferred to IFNγ-ELISPOT plates. Spots indicating IFNγ-producing cells were counted after 48 hours. The number of spots by SOCS1-KIR treated cells, at 11 μM, was significantly different from that of the control cells as determined by the Mann-Whitney signed-rank test. **P < 0.001. B) CD8+ T cells were isolated and treated as in part A. Spots indicating IFNγ-producing cells were counted after 48 hours. The number of spots by SOCS1-KIR treated cells, at 11 and 33 μM, was significantly different from that of the control cells as determined by the Mann-Whitney signed-rank test. *P < 0.01. Samples were run in triplicate and the data are representative of three separate experiments. Viabilities of treated and control cells were similar, approximately 90%.
Figure 9
Figure 9. SOCS1-KIR inhibits enhanced STAT3 activation by IL-23 and IL-17A
A) SOCS1- KIR inhibits IL-23-enhanced STAT3 phosphorylation. Splenocytes isolated from MBP-immunized mice experiencing EAE (stage 1, five weeks after immunization), were treated with the above peptides for 2 hours, followed by incubation with IL-23 (10 ng/ml) for 10 minutes. The cells were lysed and protein concentration was determined by the standard BCA assay. The cell lysates were resolved using SDS-PAGE and proteins were transferred onto a nitrocellulose membrane. The membranes were probed for pSTAT3 (top) or STAT3 (bottom). Relative intensity of the bands was measured with ImageJ software (NIH) and is shown below the pSTAT3 blot. B) SOCS1-KIR inhibits STAT3 phosphorylation in splenocytes treated with IL-17. Splenocytes isolated from MBPimmunized mice were treated with the above peptides for 2 hours, followed by incubation with IL-17 (100 ng/ml) for 2 hours. Western blots were performed and analyzed as described for part A; however, longer exposure times were necessary. The experiments were performed twice with similar results.
Figure 10
Figure 10. SOCS1-KIR regulates TLR4 signaling
A) SOCS1-KIR inhibits LPS-induced macrophage activity. Murine macrophages (RAW264.7) were incubated with varying concentrations of LPS alone, SOCS1-KIR, or control peptide, at 24 μM final concentration, for 48 hours. Culture supernatants were collected and nitrite concentration was determined using Griess reagent. There were statistically significant differences between SOCS1-KIR treated cells (0.5 and 1.0 μg/ml LPS) when compared to the control peptide treated cells as determined by Mann-Whitney signed rank test. *P < 0.001. The experiments were performed in triplicate and data are representative of two independent experiments. B) Hydropathic profiles of murine JAK2 autophosphorylation site with candidate tyrosine phosphorylation site peptides of murine MAL. The autophosphorylation site of JAK2 and MAL(82–94) show similar hydropathic profiles, while MAL(154–166) candidate site had a different hydropathic profile. C) SOCS1-KIR binds to a tyrosine phosphorylation site on the TLR4 cytosolic protein MAL. SOCS1-KIR (3 μg/well) was bound to a 96-well plate and increasing concentrations of biotinylated MAL(82–94), biotinylated MAL(154–166), or biotinylated JAK2 were added. Bound biotinylated peptide was detected with HRP-conjugated neutravidin, followed by the addition of substrate. The reaction was stopped with 2 N H2SO4. Absorbance was read at 490 nm. D) Inhibition of MAL degradation in RAW264.7 macrophages. Cells (2.5 × 10⁶ cells/ml) were treated with LPS (1 μg/ml) in the absence or presence of SOCS1-KIR, MAL(82–94), or control peptide for the indicated times. Westerns were performed with anti-MAL antibodies. The media lane is a negative control for all treatments, which were completed in one experiment. The data are representative of three independent experiments.

Similar articles

Cited by

References

    1. Abbott NJ, Patabendige AAK, Dolman DEM, Yusof SR, Begey DJ. Structure and function of the blood-brain barrier. Neurobio Dis. 2010;37:13–25. - PubMed
    1. Abromson-Leeman S, Bronson RT, Dorf ME. Encephalitogenic T cells that stably express both T-bet and RORγt consistently produce IFNγ but have a spectrum of IL-17 profiles. J Neuroimmuno. 2009;215:10–24. - PMC - PubMed
    1. Ahmed CM, Dabelic R, Waiboci LW, Jager LD, Heron LL, Johnson HM. SOCS-1 mimetics protect mice against lethal poxvirus infection: identification of a novel endogenous antiviral system. J Virol. 2009;83:1402–1415. - PMC - PubMed
    1. Alexander WS, Hilton DJ. The role of suppressors of cytokine signaling (SOCS) proteins in regulation of the immune response. Ann Rev Immunol. 2004;22:503–529. - PubMed
    1. Babon JJ, Sabo JK, Zhang JG, Nicola NA, Norton RS. The SOCS box encodes a hierarchy of affinities for cullin5: implications for ubiquitin ligase formation and cytokine signaling suppression. J Mol Biol. 2009;387:162–174. - PMC - PubMed

Publication types

MeSH terms