. 2011 Apr;39(7):2855-68.
doi: 10.1093/nar/gkq1252. Epub 2010 Dec 3.

Translation on demand by a simple RNA-based thermosensor

Affiliations

Translation on demand by a simple RNA-based thermosensor

Jens Kortmann et al. Nucleic Acids Res. 2011 Apr.

Abstract

Structured RNA regions are important gene control elements in prokaryotes and eukaryotes. Here, we show that the mRNA of a cyanobacterial heat shock gene contains a built-in thermosensor critical for photosynthetic activity under stress conditions. The exceptionally short 5'-untranslated region is comprised of a single hairpin with an internal asymmetric loop. It inhibits translation of the Synechocystis hsp17 transcript at normal growth conditions, permits translation initiation under stress conditions and shuts down Hsp17 production in the recovery phase. Point mutations that stabilized or destabilized the RNA structure deregulated reporter gene expression in vivo and ribosome binding in vitro. Introduction of such point mutations into the Synechocystis genome produced severe phenotypic defects. Reversible formation of the open and closed structure was beneficial for viability, integrity of the photosystem and oxygen evolution. Continuous production of Hsp17 was detrimental when the stress declined indicating that shutting-off heat shock protein production is an important, previously unrecognized function of RNA thermometers. We discovered a simple biosensor that strictly adjusts the cellular level of a molecular chaperone to the physiological need.


Figures
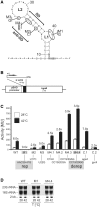
Figure 1.
Figure 1.
Translational control by the hsp17 UTR element in E. coli. (A) The secondary structure as predicted by the mfold program (40) of the entire hsp17 5′-UTR is shown. The start codon (AUG, marked by gray box) is located 45 nt downstream of the transcription start site. The SD and anti-SD sequences, loop1 (L1) and loop2 (L2) are labeled. Site-directed mutations M1–M4 and the exchanged nucleotides are indicated; RR, variable nucleotides derived from random mutagenesis (primer: hsp17therm-M4-fw + hsp17therm-M4-rv, Supplementary Table S1). (B) Schematic representation of the reporter gene fusion on plasmid pBAD-bgaB. Additional nucleotides inserted due to the position of the NheI cloning site relative to the pBAD promoter are indicated by a box upstream of the 5′-UTR. The artifical nucleotides at the 5′-end of the hsp17 transcript do not influence RNA folding and expression of the gene (data not shown). (C) Expression of the translational bgaB reporter fusions (Miller Units, MU) to various hsp17 5′-UTRs. Escherichia coli DH5α cells containing the corresponding plasmids were grown in LB medium at 28°C and either kept at this temperature (white columns) or transferred to 42°C (black columns) for 30 min before β-galactosidase activity was measured. All experiments were repeated at least in triplicate. Induction rates are shown above each fusion. A Salmonella agsA-bgaB fusion [fourU element; (27)] was used as a positive control (C.1), while E. coli gyrA-bgaB (27) served as a negative control (C.2). Absolute β-galactosidase levels are listed in Supplementary Table S2. (D) mRNA levels of hsp17-bgaB fusions before and after heat shock. Total RNA was extracted from E. coli cultures incubated at either 28 or 42°C. Equal amounts were separated on a 1.2% denaturing agarose gel and northern blot experiments were carried out using digoxygenin-labeled RNA probes to detect bgaB transcripts. Ethidum–bromide stained rRNAs from the gel before blotting are shown as loading control. The bgaB fusion transcript runs at 2 kb.
Figure 2.
Figure 2.
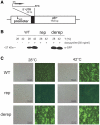
The hsp17 5′-UTR controls gfp expression in E. coli. (A) Schematic representation of the reporter gene fusions on the low-copy vector pXG10 (31). (B) Detection of GFP fusion proteins. Escherichia coli DH5αZ1 cells (46) carrying reporter plasmids with the WT, rep and derep hsp17 UTR element were grown in LB medium at 28°C. Following heat shock as described in the legend to Figure 1C, cells were incubated at room temperature for 90 min to allow fully maturation of GFP fusion proteins. Samples were subjected to western blot analysis using monoclonal α-GFP antibodies. Transcription of the gfp fusions was induced by application of doxycycline (50 ng/ml), which inactivates the Tet repressor. (C) Aliquots from the same samples were inspected by phase contrast and fluorescence microscopy. GFP fluorescence was excited at 460 nm, and light emission was recorded using a 510 nm filter. Representative examples are shown from three independent experiments, all of which gave similar results.
Figure 3.
Figure 3.
Enzymatic and chemical probing of hsp17 UTR variants. (A and B) Enzymatic hydrolysis and lead(II)-induced cleavages performed on 5′-end-labeled hsp17 5′-UTR at 28 or 42°C. The conditions for RNase and lead(II) concentrations were as follows: (A) RNase T1 (0.004 and 0.01U), RNase V (0.008 and 0.02 U); (B) lead(II) (10 and 20 mM). RNA fragments were separated on 8% polyacrylamide gels. Lanes N, controls without RNase or modifying agents; lanes T, RNase T1 cleavages under denaturing conditions; lane L, alkaline ladder. Start codon (SC), internal loop1 (L1), Shine–Dalgarno (SD), loop2 (L2) and anti-SD regions are indicated. (C) Computer-predicted secondary structures and enzymatic and lead(II)-induced cleavage sites of WT and mutated hsp17 UTRs. Cleavage sites introduced at 28°C by lowest enzyme or lead(II) concentrations are depicted by arrows as indicated. Circled nucleotides are highly susceptible to RNase T1 at 42°C. Enhanced lead(II) cleavage at 28°C occurred at nucleotides marked by asterisks.
Figure 4.
Figure 4.
Melting studies of hsp17 thermometer element by CD spectroscopy. (A) Temperature-dependent fraction of unfolded RNA α(T) of the hsp17 WT (blue line), derep (black line) and rep (red line) RNA as derived from CD unfolding curves recorded at a wavelength of 263 nm. (B) Comparison of unfolding and refolding α(T) curves of the hsp17 WT RNA as derived from CD unfolding and refolding curves recorded at a wavelength of 263 nm.
Figure 5.
Figure 5.
Temperature-dependent ribosome binding to the hsp17 5′-UTR. Toeprinting was carried out on 2 pmol of WT, rep and derep RNAs as described in ‘Materials and Methods’ section. The absence (−) or presence (+) of 30S subunits is indicated. Terminated reverse transcription products (toeprints) at position +17 relative to the A of the translation start codon and full-length products are pointed out by arrows. TGCA refers to a sequencing ladder generated with the same oligonucleotide as in the toeprint experiments. The position of the start codon is boxed.
Figure 6.
Figure 6.
Effect of chromosomally integrated hsp17 UTR variants on Hsp17 production in Synechocystis. (A) Outline of the strategy for construction of hsp17 mutants. The Synechocystis HK-1 (Δhsp17) strain was used for integration of hsp17 and its 5′-UTR via up and downstream flanking sequences. SmR, spectinomycin resistance; KmR, kanamycin resistance. Homologous recombination resulted in generation of the so-called ‘WT’, Rep and Derep strains. (B and C) Determination of hsp17 mRNA and Hsp17 protein levels by northern and western analysis, respectively. Total RNA and protein was extracted from Synechocystis cells incubated at either 28 or 42°C. Ethidium bromide stained 16 s rRNA served as a loading control in northern blot experiments. Equal amounts of total protein were checked by Coomassie-stained SDS–PAGE gels (data not shown). A digoxygenin-labeled RNA probe was used to detect hsp17 transcripts, Hsp17 protein was detected via monoclonal α-Hsp17 antibody. (C) Synechocystis cells were incubated under low light (LL: 30 µmol photons m−2 s−1) or high light (HL: 600 µmol photons m−2 s−1) conditions at 28°C for 30 min. Temperature-stability of the culture was monitored. Subsequent northern and western analysis was conducted as described above.
Figure 7.
Figure 7.
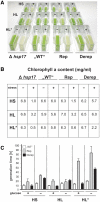
Stress-induced phenotypes of Synechocystis hsp17 mutants. (A) Cells were grown to early log phase prior to stress treatment. HS, cells were incubated at 42°C for 6 h; HL, cells were exposed to 600 µmol photons m−2 s−1 for 6 h; HL*, cells were incubated at 42°C for 60 min prior to 5 h HL (600 µmol photons m−2 s−1) treatment. Following the different stress conditions, the cultures were transferred to 28°C and LL conditions for 5 days. Before documentation, cultures were diluted to an optical density (OD730) of 1.5. Representative examples of at least three experimental repetitions are shown. (B) Samples from these Synechocystis cell cultures were used for Chl a extraction. (C) Early log phase cells grown in the presence or absence of glucose were treated with HS, HL, HL* as described in (A). After treatment, cells were transferred to 28°C and LL conditions for 48 h.
Figure 8.
Figure 8.
Integrity of the photosynthetic machinery in Synechocystis strains with mutated hsp17 5′-UTRs. (A) The temperature effect on Chl a fluorescence was measured over a temperature range from 30°C to 60°C in ‘WT’ (circles), Rep (squares) and Derep (triangles) cells grown at 28°C under LL conditions. (B) The impact of light stress on Chl a fluorescence was measured in cells from the same pre-culture as in (A). Cultures were exposed to HL over a period of 380 min. (C) Oxygen evolution was monitored after a heat shock from 28°C to 42°C at the indicated time points. After 380 min, cultures were returned to 28°C. (D) Oxygen evolution after shift to HL conditions. For recovery, the cultures were returned to LL conditions for 60 min. Cells from the same cultures were used for the experiments in (C) and (D). Results are presented as percentage of the oxygen evolution rate measured at time 0. The photosynthetic activities before stress treatment were 3.02 ± 0.04, 2.96 ± 0.01 and 2.87 ± 0.07 µmol O2 mg Chl−1 min−1 in the ‘WT’ (circles), Rep (squares) and Derep (triangles) strains, respectively. Error bars represent standard deviations obtained from three independent experiments.
Figure 9.
Figure 9.
The 5′-UTR of the Synechocystis hsp17 gene controls translation on demand. The WT RNA forms a secondary structure at physiological temperature (28°C) masking the ribosomal binding site of hsp17, thus preventing the binding of the ribosome. A heat shock induces hsp17 transcription. Concomitant melting of the hairpin structure in the 5′-UTR allows translation initiation. A downshift to physiological temperatures shuts off translation in spite of high transcript levels. Transcriptional induction of the Derep and Rep variants is unaffected. However, the blocked SD sequence in the Rep mutant prevents translation under all conditions, whereas translation is constitutively on in the Derep mutant.

Similar articles

Cited by

References

    1. Castielli O, De la Cerda B, Navarro JA, Hervas M, De la Rosa MA. Proteomic analyses of the response of cyanobacteria to different stress conditions. FEBS Lett. 2009;583:1753–1758. - PubMed
    1. Latifi A, Ruiz M, Zhang CC. Oxidative stress in cyanobacteria. FEMS Microbiol. Rev. 2009;33:258–278. - PubMed
    1. Lee S, Prochaska DJ, Fang F, Barnum SR. A 16.6-kilodalton protein in the Cyanobacterium Synechocystis sp. PCC 6803 plays a role in the heat shock response. Curr. Microbiol. 1998;37:403–407. - PubMed
    1. Nakamoto H, Vígh L. The small heat shock proteins and their clients. Cell. Mol. Life Sci. 2007;64:294–306. - PMC - PubMed
    1. Narberhaus F. Alpha-crystallin-type heat shock proteins: socializing minichaperones in the context of a multichaperone network. Microbiol. Mol. Biol. Rev. 2002;66:64–93. - PMC - PubMed

Publication types