The group II intron ribonucleoprotein precursor is a large, loosely packed structure
- PMID: 21131279
- PMCID: PMC3074136
- DOI: 10.1093/nar/gkq1202
The group II intron ribonucleoprotein precursor is a large, loosely packed structure
Abstract
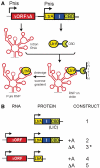
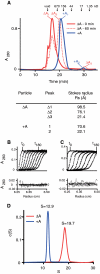
Group II self-splicing introns are phylogenetically diverse retroelements that are widely held to be the ancestors of spliceosomal introns and retrotransposons that insert into DNA. Folding of group II intron RNA is often guided by an intron-encoded protein to form a catalytically active ribonucleoprotein (RNP) complex that plays a key role in the activity of the intron. To date, possible structural differences between the intron RNP in its precursor and spliced forms remain unexplored. In this work, we have trapped the native Lactococcus lactis group II intron RNP complex in its precursor form, by deleting the adenosine nucleophile that initiates splicing. Sedimentation velocity, size-exclusion chromatography and cryo-electron microscopy provide the first glimpse of the intron RNP precursor as a large, loosely packed structure. The dimensions contrast with those of compact spliced introns, implying that the RNP undergoes a dramatic conformational change to achieve the catalytically active state.
Figures


Similar articles
-
Quaternary arrangement of an active, native group II intron ribonucleoprotein complex revealed by small-angle X-ray scattering.Nucleic Acids Res. 2014 Apr;42(8):5347-60. doi: 10.1093/nar/gku140. Epub 2014 Feb 24. Nucleic Acids Res. 2014. PMID: 24567547 Free PMC article.
-
Structural accommodations accompanying splicing of a group II intron RNP.Nucleic Acids Res. 2018 Sep 19;46(16):8542-8556. doi: 10.1093/nar/gky416. Nucleic Acids Res. 2018. PMID: 29790987 Free PMC article.
-
Exon and protein positioning in a pre-catalytic group II intron RNP primed for splicing.Nucleic Acids Res. 2020 Nov 4;48(19):11185-11198. doi: 10.1093/nar/gkaa773. Nucleic Acids Res. 2020. PMID: 33021674 Free PMC article.
-
Group II Intron RNPs and Reverse Transcriptases: From Retroelements to Research Tools.Cold Spring Harb Perspect Biol. 2019 Apr 1;11(4):a032375. doi: 10.1101/cshperspect.a032375. Cold Spring Harb Perspect Biol. 2019. PMID: 30936187 Free PMC article. Review.
-
The mechanism of splicing as told by group II introns: Ancestors of the spliceosome.Biochim Biophys Acta Gene Regul Mech. 2019 Nov-Dec;1862(11-12):194390. doi: 10.1016/j.bbagrm.2019.06.001. Epub 2019 Jun 13. Biochim Biophys Acta Gene Regul Mech. 2019. PMID: 31202783 Review.
Cited by
-
Quaternary arrangement of an active, native group II intron ribonucleoprotein complex revealed by small-angle X-ray scattering.Nucleic Acids Res. 2014 Apr;42(8):5347-60. doi: 10.1093/nar/gku140. Epub 2014 Feb 24. Nucleic Acids Res. 2014. PMID: 24567547 Free PMC article.
-
Structural accommodations accompanying splicing of a group II intron RNP.Nucleic Acids Res. 2018 Sep 19;46(16):8542-8556. doi: 10.1093/nar/gky416. Nucleic Acids Res. 2018. PMID: 29790987 Free PMC article.
-
Forks in the tracks: Group II introns, spliceosomes, telomeres and beyond.RNA Biol. 2016 Dec;13(12):1218-1222. doi: 10.1080/15476286.2016.1244595. Epub 2016 Oct 11. RNA Biol. 2016. PMID: 27726484 Free PMC article.
-
Exon and protein positioning in a pre-catalytic group II intron RNP primed for splicing.Nucleic Acids Res. 2020 Nov 4;48(19):11185-11198. doi: 10.1093/nar/gkaa773. Nucleic Acids Res. 2020. PMID: 33021674 Free PMC article.
-
The Chloroplast Trans-Splicing RNA-Protein Supercomplex from the Green Alga Chlamydomonas reinhardtii.Cells. 2021 Feb 1;10(2):290. doi: 10.3390/cells10020290. Cells. 2021. PMID: 33535503 Free PMC article. Review.
References
-
- Belfort M, Derbyshire V, Cousineau B, Lambowitz A. Mobile introns: pathways and proteins. In: Craig N, Craigie R, Gellert M, Lambowitz A, editors. Mobile DNA II. ASM Press; 2002. pp. 761–783.
-
- Pyle AM, Lambowitz AM. The RNA World. 3rd edn. Cold Spring Harbor Laboratory Press; 2006. Group II introns: ribozymes that splice RNA and invade DNA; pp. 469–505.
-
- Cech TR. The generality of self-splicing RNA: relationship to nuclear mRNA splicing. Cell. 1986;44:207–210. - PubMed
-
- Cavalier-Smith T. Intron phylogeny: a new hypothesis. Trends Genet. 1991;7:145–148. - PubMed

