. 2011 Mar 1;20(5):855-66.
doi: 10.1093/hmg/ddq525. Epub 2010 Dec 2.

Downregulation of NCC and NKCC2 cotransporters by kidney-specific WNK1 revealed by gene disruption and transgenic mouse models

Affiliations

Downregulation of NCC and NKCC2 cotransporters by kidney-specific WNK1 revealed by gene disruption and transgenic mouse models

Zhen Liu et al. Hum Mol Genet. .

Abstract

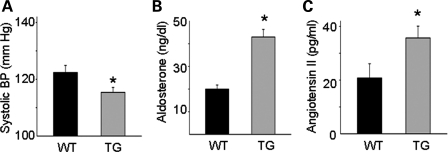
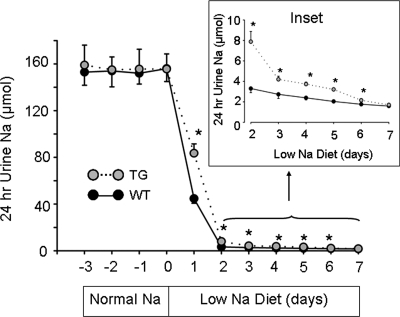
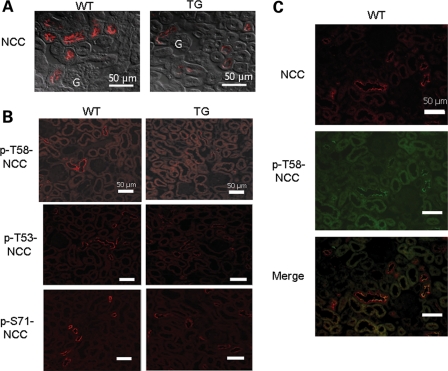
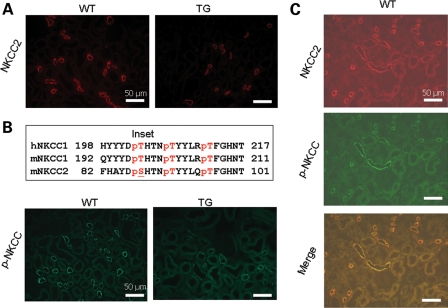
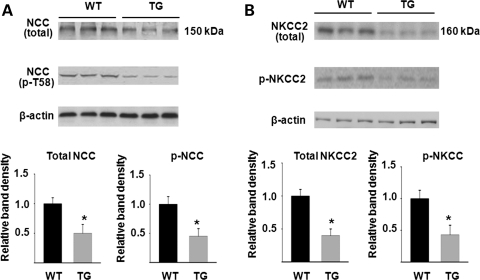
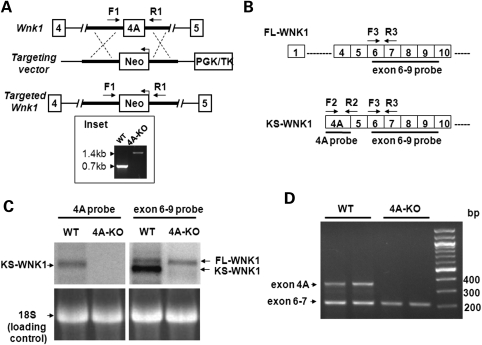
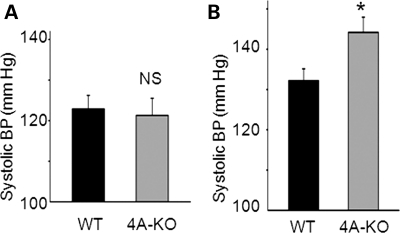
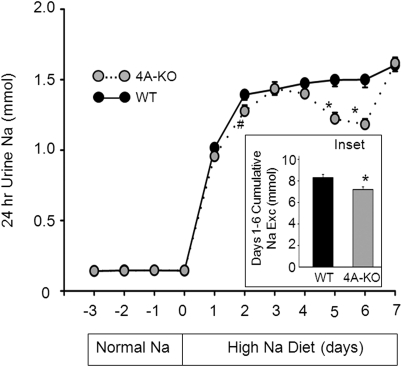
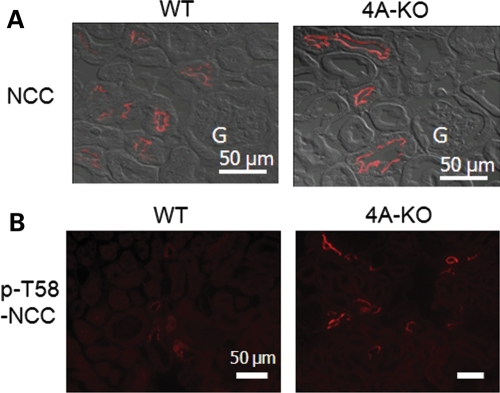
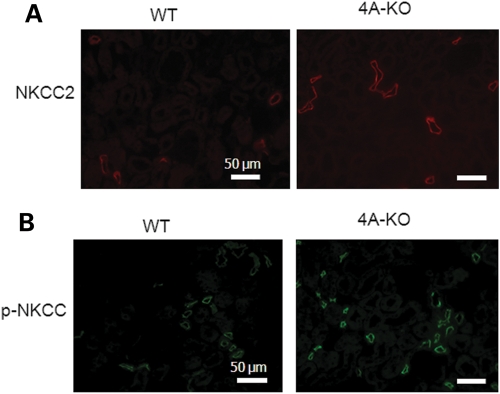
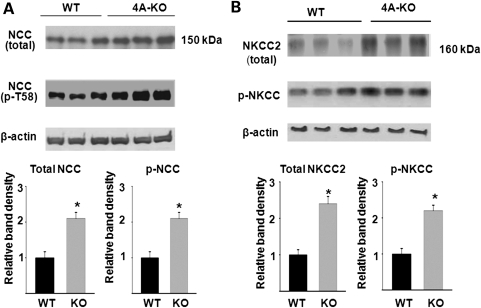
WNK1 (with-no-lysine[K]-1) is a protein kinase of which mutations cause a familial hypertension and hyperkalemia syndrome known as pseudohypoaldosteronism type 2 (PHA2). Kidney-specific (KS) WNK1 is an alternatively spliced form of WNK1 kinase missing most of the kinase domain. KS-WNK1 downregulates the Na(+)-Cl(-) cotransporter NCC by antagonizing the effect of full-length WNK1 when expressed in Xenopus oocytes. The physiological role of KS-WNK1 in the regulation of NCC and potentially other Na(+) transporters in vivo is unknown. Here, we report that mice overexpressing KS-WNK1 in the kidney exhibited renal Na(+) wasting, elevated plasma levels of angiotensin II and aldosterone yet lower blood pressure relative to wild-type littermates. Immunofluorescent staining revealed reduced surface expression of total and phosphorylated NCC and the Na(+)-K(+)-2Cl(-) cotransporter NKCC2 in the distal convoluted tubule and the thick ascending limb of Henle's loop, respectively. Conversely, mice with targeted deletion of exon 4A (the first exon for KS-WNK1) exhibited Na(+) retention, elevated blood pressure on a high-Na(+) diet and increased surface expression of total and phosphorylated NCC and NKCC2 in respective nephron segments. Thus, KS-WNK1 is a negative regulator of NCC and NKCC2 in vivo and plays an important role in the control of Na(+) homeostasis and blood pressure. These results have important implications to the pathogenesis of PHA2 with WNK1 mutations.


Figures

Figure 1.
Figure 1.
Blood pressure (A), plasma aldosterone (B) and angiotensin II (C) levels in WT and KS-WNK1-TG (TG) mice. Mice were on normal rodent diets. The asterisk indicates P< 0.05 versus WT mice.
Figure 2.
Figure 2.
Urinary Na+ excretion in response to dietary Na+ restriction. Shown are Na+ excretion in KS-WNK1-TG (gray circles, n = 8, mean ± SEM) and WT mice (black circles, n = 8, mean ± SEM). Twenty-four-hour urine was collected daily on normal Na+ diets (0.49% NaCl) for 4 days (−3, −2, −1, 0). Diets were switched to low-Na+ diets (0.01% NaCl) on day 0 and 24 h urine collection continued for 7 days. Inset is Na+ excretion in day 2–7 of low-Na+ diets shown in an expanded scale. The asterisk indicates P< 0.05 versus WT mice.
Figure 3.
Figure 3.
Immunofluorescent staining of NCC in WT and KS-WNK1-TG mice. (A) Immunofluorescence of NCC in the renal cortex of homozygous TG mice and WT mice. The microscopic images were obtained using ×40 objective lens. Fluorescent images were merged with differential interference contract image to better illustrate subcellular distribution. Scale bar: 50 µm. ‘G’ indicates glomerulus. (B) Immunofluorescence of p-NCC (T58, T53, S71) in TG and WT mice. Cortical sections of kidneys were subjected to immunofluorescent staining using indicated residue-specific anti-phosphor-antibodies (T58, T53 and S71) and visualized at a magnification of ×20. Scale bar: 50 µm. (C) Double-immunofluorescent staining of NCC (red, rabbit antibody) and p-T58-NCC (green, sheep antibody) in WT mice. Scale bar: 50 µm.
Figure 4.
Figure 4.
Immunofluorescent staining of NKCC2 in WT and KS-WNK1-TG mice. (A) Immunofluorescence of NKCC2 in the cortex of TG and WT mice. Scale bar: 50 µm. (B) Immunofluorescence of p-NKCC in the cortex of TG and WT mice. Scale bar: 50 µm. Inset shows amino acid sequence of human NKCC1 used for generating pan anti-p-NKCC antibody, and the corresponding sequence of mouse NKCC1 and NKCC2. Single-letter denotation of amino acids is used. ‘p’ indicates phosphate residue attached to the following threonine or serine. (C) Double-staining of NKCC2 (red, rabbit antibody) and p-NKCC (green, sheep antibody) in WT mice. Scale bar: 50 µm.
Figure 5.
Figure 5.
Semi-quantitative western blot analysis of total and phosphorylated NCC (A) and NKCC2 (B) abundance in WT and KS-WNK1-TG mice. Top panels are representative blots from three separate experiments (each experiment includes three control and three mutant mice). Lower panels summarize densitometric analysis of NCC, p-NCC, NKCC2, p-NKCC normalized to β-actin. Bar graph (mean ± SEM, n = 9 combined from three separate experiments) shows density relative to WT (i.e. WT = 1). The asterisk indicates P < 0.05 versus WT by two-tailed unpaired Student's t-test.
Figure 6.
Figure 6.
Generation of KS-WNK1-null mice and confirmation of lack of KS-WNK1 expression. (A) Targeting strategy for generating 4A-KO mice. The diagram shows WT Wnk1 locus, targeting construct and the targeted locus with the deletion of exon4A. Genotyping was performed by PCR using a primer set (F1 and R1) flanking exon4A. The 0.7 kb band represents the WT allele, and the 1.4 kb band represents the targeted allele containing Neo gene (in reverse orientation). (B) Diagram for initial exons of FL-WNK1 and KS-WNK1. Probes for northern blot analysis of exon 4A and exons 6–9 (solid lines) and primers for RT-PCR analysis (arrows) used in the studies shown in (C) and (D) are shown. (C) Northern blot analysis of WNK1 expression in the kidney of 4A-KO mice and WT littermate controls. Exon 4A probe detected KS-WNK1 transcript in WT, but not in 4A-KO mice. Exon 6–9 probe detected two transcripts representing FL-WNK1 and KS-WNK1, respectively, in WT mice, but detected only one transcript representing FL-WNK1 in 4A-KO mice. Also shown is 18S RNA as loading controls. (D) RT-PCR analysis of WNK1 transcripts in the WT and 4A-KO kidney. PCR primers targeting exon 4A (F2/R2 shown in B) and exons 6–7 (F3/R3, B) were combined in the same PCR reaction to detect the expression of WNK1 isoforms.
Figure 7.
Figure 7.
Blood pressure in WT and KS-WNK1-KO mice in normal Na+ diets (0.49% NaCl) (A) or high-Na+ diets (4% NaCl) (B). The asterisk indicates P< 0.05 versus WT.
Figure 8.
Figure 8.
Urinary Na+ excretion in response to high-Na+ diets in KS-WNK1-KO and WT mice. Shown are Na+ excretion in KS-WNK1-KO mice (gray circles, n = 9, mean ± SEM) and WT mice (black circles = 9, mean ± SEM) under normal Na+ (0.49% NaCl; day −3 to −1) and high-Na+ diets (4% NaCl; day 1–7). On day 0, mice were switched from normal Na+ diets to high-Na+ diets. The asterisk and hash indicate P < 0.05 and P = 0.05 versus WT, respectively. Inset shows cumulative Na+ excretion from day 1 to 6 of high-Na+ diets.
Figure 9.
Figure 9.
Immunofluorescent staining of NCC in WT and KS-WNK1-KO mice. (A) Immunofluorescence of NCC in the cortex of KS-WNK1-KO and WT mice. Fluorescent images were overlapped with differential interference contrast images to better illustrate subcellular distribution. Shown are microscopic images obtained using ×40 objective lens. Scale bar: 50 µm. ‘G’ indicates glomerulus. (B) Immunofluorescence of p-NCC (Thr 58) in KS-WNK1-KO and WT mice. Scale bar: 50 µm.
Figure 10.
Figure 10.
Immunofluorescent staining of NKCC2 in WT and KS-WNK1-KO mice. (A) Immunofluorescence of NKCC2 in KS-WNK1-KO and WT mice. Scale bar: 50 µm. (B) Immunofluorescence of p-NKCC in KS-WNK1-KO and WT mice. Scale bar: 50 µm.
Figure 11.
Figure 11.
Semi-quantitative western blot analysis of total and phosphorylated NCC (A) and NKCC2 (B) abundance in WT and KS-WNK1-KO (4A-KO) mice. Top panels are representative blots from three separate experiments (each experiment includes three control and three mutant mice). Lower panels summarize densitometric analysis of NCC, p-NCC, NKCC2, p-NKCC normalized to β-actin. Bar graph (mean ± SEM, n = 9 combined from three separate experiments) shows density relative to WT (i.e. WT = 1). The asterisk indicates P < 0.05 versus WT by two-tailed unpaired Student's t-test.

References

    1. Xu B., English J.M., Wilsbacher J.L., Stippec S., Goldsmith E.J., Cobb M.H. WNK1, a novel mammalian serine/threonine protein kinase lacking the catalytic lysine in subdomain II. J. Biol. Chem. 2000;275:16795–16801. doi:10.1074/jbc.275.22.16795. - DOI - PubMed
    1. Wilson F.H., Disse-Nicodème S., Choate K.A., Ishikawa K., Nelson-Williams C., Desitter I., Gunel M., Milford D.V., Lipkin G.W., Achard J.M., et al. Human hypertension caused by mutations in WNK kinases. Science. 2001;293:1107–1112. doi:10.1126/science.1062844. - DOI - PubMed
    1. Veríssimo F., Jordan P. WNK kinases, a novel protein kinase subfamily in multi-cellular organisms. Oncogene. 2001;20:5562–5569. doi:10.1038/sj.onc.1204726. - DOI - PubMed
    1. Yang C.L., Angell J., Mitchell R., Ellison D.H. WNK kinases regulate thiazide-sensitive Na-Cl cotransport. J. Clin. Invest. 2003;111:1039–1045. - PMC - PubMed
    1. Wilson F.H., Kahle K.T., Sabath E., Lalioti M.D., Rapson A.K., Hoover R.S., Hebert S.C., Gamba G., Lifton R.P. Molecular pathogenesis of inherited hypertension with hyperkalemia: the Na-Cl cotransporter is inhibited by wild-type but not mutant WNK4. Proc. Natl Acad. Sci. USA. 2003;100:680–684. doi:10.1073/pnas.242735399. - DOI - PMC - PubMed

Publication types

MeSH terms