. 2011 Feb 4;286(5):4027-42.
doi: 10.1074/jbc.M110.184994. Epub 2010 Dec 3.

Induction of miR-21 by retinoic acid in estrogen receptor-positive breast carcinoma cells: biological correlates and molecular targets

Affiliations

Induction of miR-21 by retinoic acid in estrogen receptor-positive breast carcinoma cells: biological correlates and molecular targets

Mineko Terao et al. J Biol Chem. .

Abstract

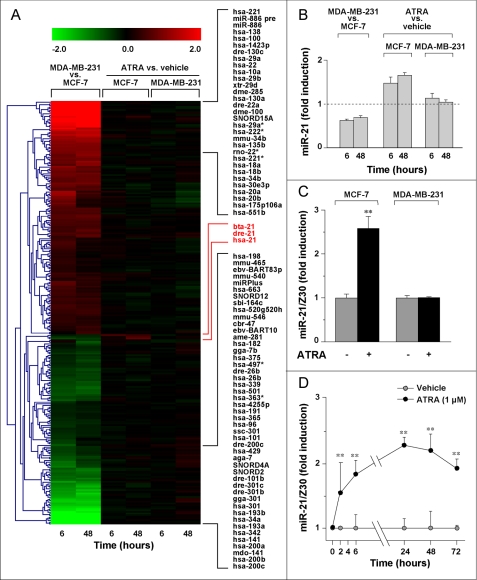
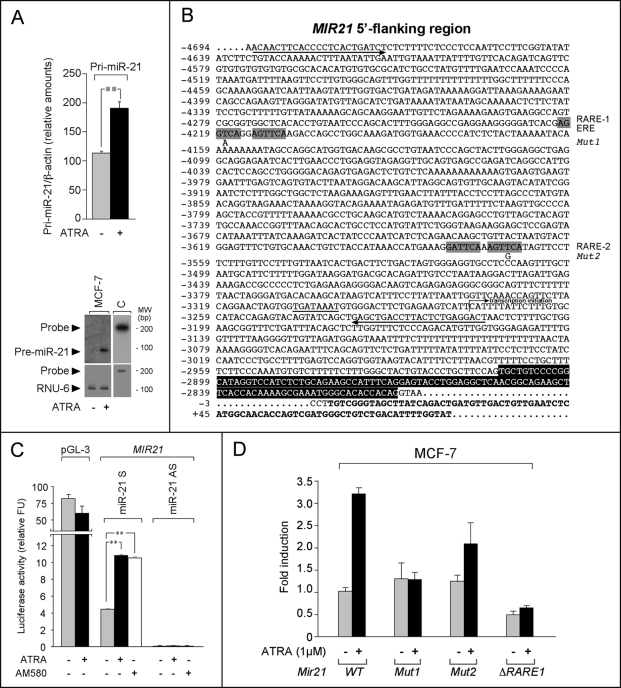
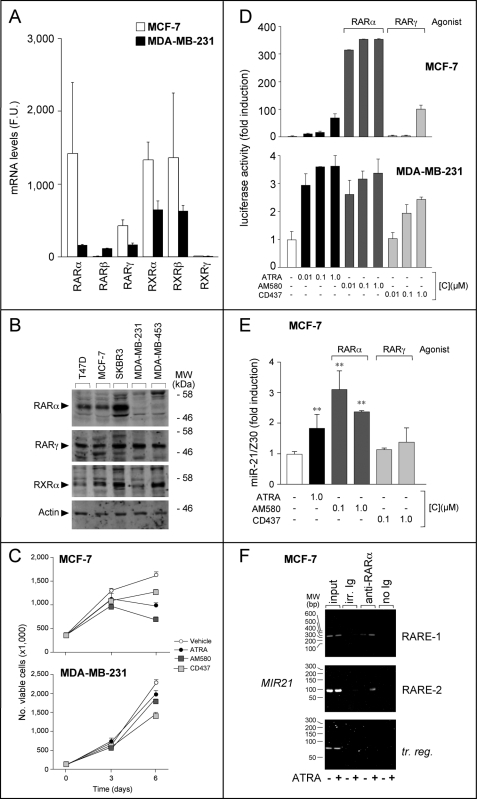
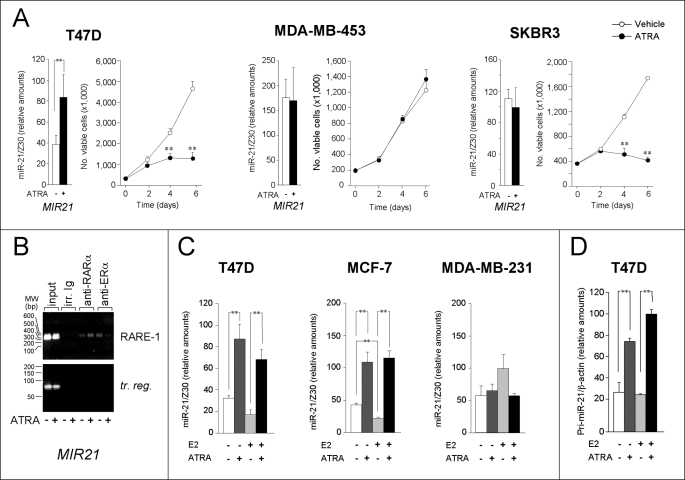
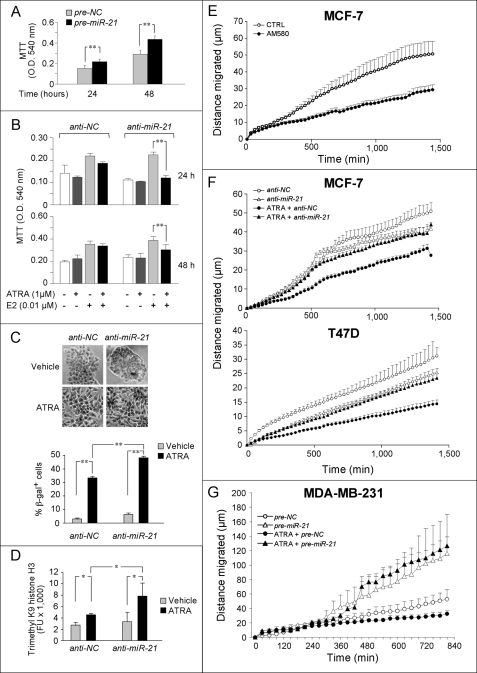
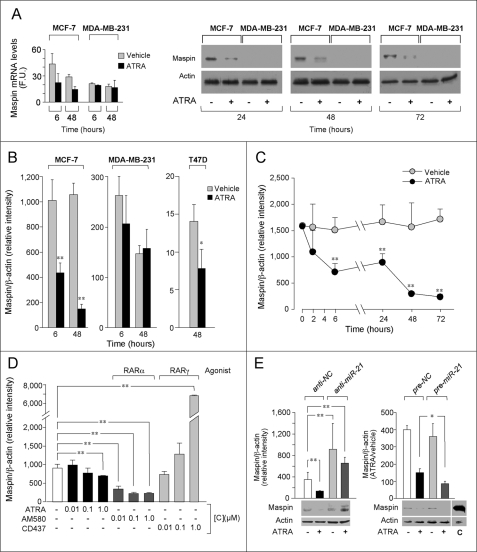
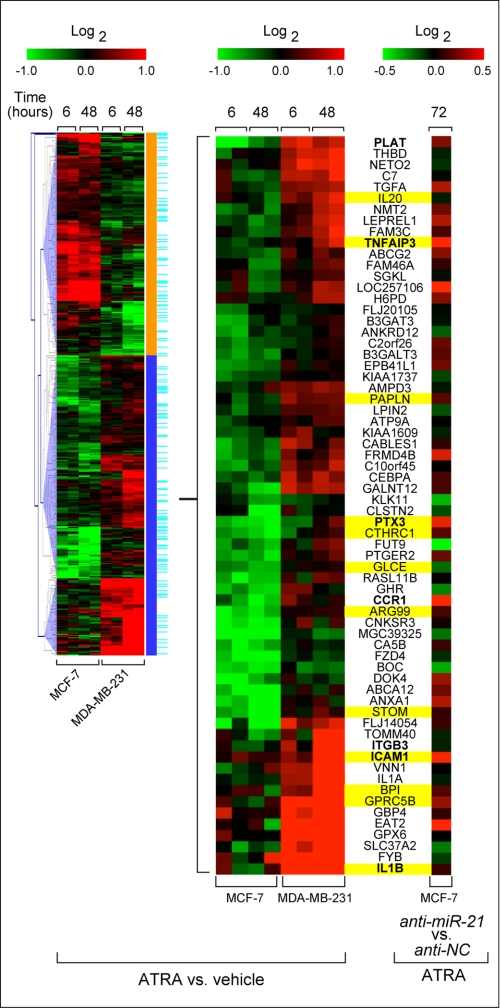
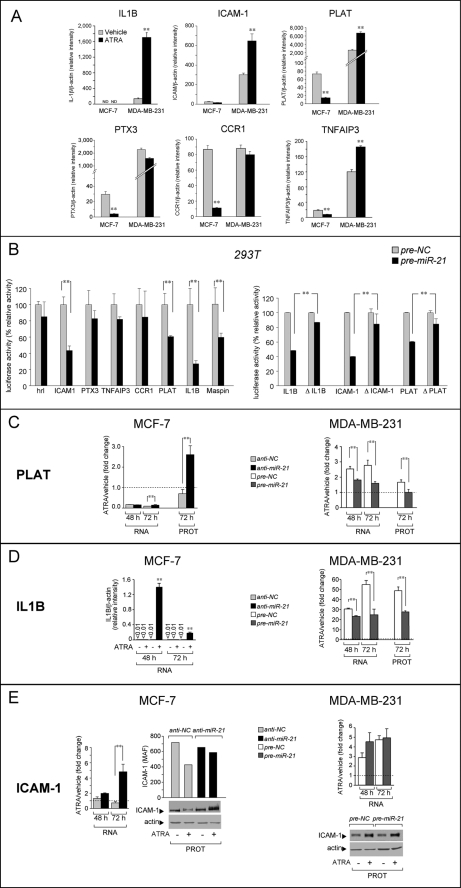
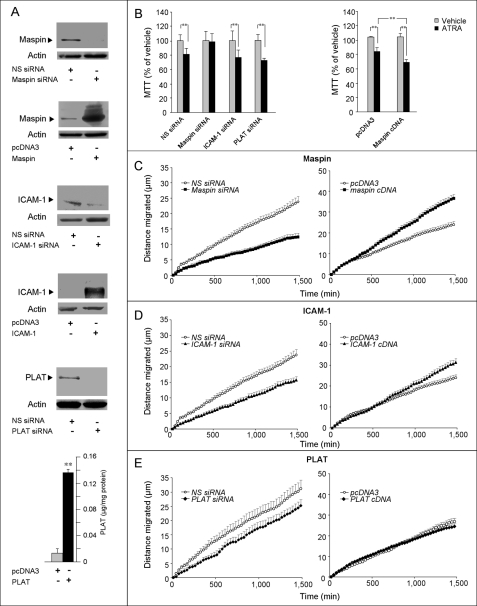
Retinoids are promising agents for the treatment/prevention of breast carcinoma. We examined the role of microRNAs in mediating the effects of all-trans-retinoic acid (ATRA), which suppresses the proliferation of estrogen receptor-positive (ERα(+)) breast carcinoma cells, such as MCF-7, but not estrogen receptor-negative cells, such as MDA-MB-231. We found that pro-oncogenic miR-21 is selectively induced by ATRA in ERα(+) cells. Induction of miR-21 counteracts the anti-proliferative action of ATRA but has the potentially beneficial effect of reducing cell motility. In ERα(+) cells, retinoid-dependent induction of miR-21 is due to increased transcription of the MIR21 gene via ligand-dependent activation of the nuclear retinoid receptor, RARα. RARα is part of the transcription complex present in the 5'-flanking region of the MIR21 gene. The receptor binds to two functional retinoic acid-responsive elements mapping upstream of the transcription initiation site. Silencing of miR-21 enhances ATRA-dependent growth inhibition and senescence while reverting suppression of cell motility afforded by the retinoid. Up-regulation of miR-21 results in retinoid-dependent inhibition of the established target, maspin. Knockdown and overexpression of maspin in MCF-7 cells indicates that the protein is involved in ATRA-induced growth inhibition and contributes to the ATRA-dependent anti-motility responses. Integration between whole genome analysis of genes differentially regulated by ATRA in MCF-7 and MDA-MB-231 cells, prediction of miR-21 regulated genes, and functional studies led to the identification of three novel direct miR-21 targets: the pro-inflammatory cytokine IL1B, the adhesion molecule ICAM-1 and PLAT, the tissue-type plasminogen activator. Evidence for ICAM-1 involvement in retinoid-dependent inhibition of MCF-7 cell motility is provided.


Figures

FIGURE 1.
FIGURE 1.
MicroRNA profiles in MCF-7 and MDA-MB-231 cells. A, heat map of microRNAs showing significant differences (adjusted p < 0.05) in at least one of the comparisons indicated. Relevant microRNAs are listed on the right. B, relative levels of miR-21 (means ± S.D. of two independent microarray experiments performed in triplicate). C, RT-PCR validation of microarray results (mean ± S.D.; three independent cultures). The cells were treated with ATRA (1 μm) for 6 h. The data are normalized for the content of the Z30 microRNA endogenous standard. The data are representative of three independent experiments. **, significantly higher than the corresponding control value (p < 0.01, Student's t test). D, time course of miR-21 induction. The results were obtained as in C and are representative of two independent experiments. **, significantly higher than the corresponding control value (p < 0.01, Student's t test).
FIGURE 2.
FIGURE 2.
Transcriptional regulation of MIR21 by retinoids in ERα+ cell lines via RARα. A, MCF-7 cells were treated with ATRA (1 μm) or vehicle (Me2SO) for 48 h. Upper panel, RT-PCR analysis of pri-miR-21, using a primer pair corresponding to sequences placed outside the miR-21 containing stem-loop region of the primary transcript. Two sets of primers were selected from the published sequence (AY699265) and used for the amplification of pri-miR-21. Because the results obtained with the two pairs of primers were superimposable, only the results obtained with the first pair are shown. Each value is the mean ± S.D. of three separate cultures. Lower panel, Northern blot analysis of pre-miR-21 (radiolabeled probe encompassing the stem-loop region). MW, molecular weight. The blot was rehybridized with a U6 snRNA probe (RNU-6) to confirm that similar amounts of low molecular weight RNA were loaded in each lane. The results are representative of two independent experiments. B, nucleotide sequence of the 5′-flanking region of the MIR21 gene. The two predicted RAREs (retinoic acid responsive elements, RARE-1 and RARE-2) and the estrogen responsive element (ERE) overlapping with RARE-1 are indicated by gray boxes. The point mutations (Mut1 and Mut2) introduced in RARE-1 and RARE-2 are indicated. The putative TATA box is underlined with a solid line. The putative transcription initiation site is indicated. The sequence boxed in black represents exon 11 of the TMEM-49 coding gene, which overlaps the MIR21 gene. The sequence in bold type corresponds to the miR-21 stem-loop. Residue +1 corresponds to the first nucleotide of the miR-21 stem-loop sequence. The two arrows below the sequence pointing in opposite directions indicate the position of the two oligonucleotides used for the amplification of the 5′-flanking region of the miR-21. C, MCF-7 cells were transfected with firefly luciferase reporter constructs driven by the 5′-flanking region of human MIR21 in the sense or antisense orientation. A plasmid containing a CMV-based enhancer/promoter was used as a negative control for the effect of ATRA (pGL-3). The cells were treated with ATRA (1 μm) or AM580 (0.1 μm) for 24 h. The results are expressed in arbitrary units following normalization with Renilla luciferase (mean ± S.D., two replicate transfections). D, functional analysis of the putative RARE-1 and RARE-2 sequences. Constructs containing the firefly luciferase reporter gene driven by the wild type MIR21 promoter (WT) or the same promoter with point mutations in RARE-1 and RARE-2 (Mut1 and Mut2, see text) or deletion of RARE-1 sequences (ΔRARE1) were transfected in MCF-7 cells, before treatment with vehicle or ATRA (1 μm) for 24 h.
FIGURE 3.
FIGURE 3.
Significance of RARα for miR-21 induction by ATRA and retinoid sensitivity in MCF-7. A, the panel shows the levels of the transcripts encoding RAR and RXR nuclear retinoic acid receptors in MCF-7 and MDA-MB-231 cells. The results were obtained from the whole genome gene expression microarray data set and represent the means ± S.D. of six separate slides. The data are expressed in absolute fluorescent units, and the values determined in MCF-7 and MDA-MB-231 are directly comparable. B, Western blot analyses of the indicated RAR and RXR proteins are shown in the panel. The results were obtained using extracts of the indicated breast carcinoma cell lines. The total amount of protein present in each lane is similar, as indicated by the β-actin signal obtained. C, the growth curves of MCF-7 and MDA-MB-231 cells incubated in the presence of vehicle (Me2SO), ATRA (1 μm), AM580 (0.1 μm), or CD437 (0.1 μm) for the indicated amounts of time are shown. Each value is the mean ± S.D. of three replicate cultures. D, MCF-7 and MDA-MB-231 cells were transfected with the retinoid-dependent reporter construct, RARE-tk-Luc, and treated for 24 h with the indicated concentrations of ATRA, AM580, or CD437 (mean ± S.D., two replicate transfections). All of the results are representative of at least two independent experiments. E, RT-PCR determination of miR-21 in MCF-7 cells treated with the indicated concentrations of ATRA, AM580, or CD437, for 48 h (mean ± S.D., three independent cultures). **, significantly higher than control (Student's t test, p < 0.01). F, ChIP assays were performed on MCF-7 cells E2-depleted for 5 days and subsequently treated with vehicle or ATRA in the presence of E2 for 2 h, using anti-RARα antibodies and relative negative controls. irr. Ig, irrelevant antibodies of the same Ig type as the anti-RARα counterparts. For the amplification of the transcribed region (tr. reg.) of MIR21, we used the same pair of amplimers described for Fig. 2A.
FIGURE 4.
FIGURE 4.
miR-21 induction in ERα and ERα+ cell lines. A, in the bar graphs, the indicated cell lines were treated with ATRA (1 μm) for 48 h. The microRNA fraction was extracted and subjected to the determination of mature miR-21 by quantitative RT-PCR. The data are normalized for the content of the Z30 microRNA endogenous standard and are the means ± S.D. of three independent cultures. **, significantly higher than the corresponding control (Student's t test, p < 0.01). The data are representative of at least two independent experiments. In the line graphs, ERα+ T47D as well as ERα SKBR3 and MDA-MB-453 cells were treated with ATRA (1 μm) for the indicated amount of time. The growth curves of the three cell lines are shown. Each value is the mean ± S.D. of three replicate cultures. **, significantly lower than the corresponding vehicle-treated value (Student's t test, p < 0.01). B, ChIP assays were performed on MCF-7 cells treated with vehicle or ATRA as in Fig. 3F, using anti-RARα and anti-ERα antibodies as well as relative negative controls. irr. Ig, irrelevant antibodies of the same Ig type as the anti-ERα counterparts. For the amplification of the transcribed region (tr. reg.) of MIR21, we used the same pair of amplimers described in Fig. 2A. The results are representative of two independent experiments. C, the indicated cell lines were depleted of E2 by culturing in F12 medium supplemented with charcoal-stripped serum for 5 days. The cells (125,000/ml) were replated and treated with vehicle, E2 (0.01 μm), ATRA (1 μm), or the combination of the two agents for 48 h. Mature miR-21 was determined as above. The data are the means ± S.D. of three independent cultures. The results shown are representative of two independent experiments. **, significantly different (Student's t test, p < 0.01). D, T47D cells were depleted of E2 and treated as in C. Total RNA was extracted and subjected to quantitative RT-PCR for the determination of pri-miR-21. The data are the means ± S.D. of three independent cultures. The results shown are representative of two independent experiments. **, significantly higher (Student's t test, p < 0.01).
FIGURE 5.
FIGURE 5.
Effects of overexpression or silencing of miR-21 on growth/senescence of MCF-7 cell and random motility of MCF-7, T47D, and MDA-MB-231 cells. A, E2-depleted MCF-7 cells were transfected with pre-miR-21 or the negative control pre-NC. Cell growth was evaluated 24 or 48 h later by the MTT assay (mean ± S.D., three independent cultures). B, E2-depleted MCF-7 cells were transfected with anti-miR-21 or the negative control, anti-NC. After 24 h from the transfection, the cells were treated with ATRA and/or E2 for further 24 or 48 h and proliferation evaluated as in A. C, E2-depleted MCF-7 cells were transfected with anti-miR-21 or anti-NC. After transfection, the cells were treated with vehicle or ATRA (1 μm) for a further 4 days in the presence of E2 (0.01 μm) and stained for the senescence marker β-galactosidase. The pictures show representative light micrographs, and the bar graph illustrates the percentage of β-galactosidase-positive cells. More than 500 cells/field, 4 fields/experimental point, were counted (mean ± S.D., three independent cultures). For A–C, **, p < 0.01 (Student's t test). The results are representative of three independent experiments. D, E2-depleted MCF-7 cells were transfected with anti-miR-21 or the negative control, anti-NC. Twenty-four hours after transfection, the cells were treated with ATRA (1 μm) or vehicle in the presence of E2 for another 48 h. Nuclear extracts were evaluated for the amounts of trimethyl K9 histone H3, a marker of senescence-associated changes in chromatin structure, using a specific ELISA assay. The results are the means ± S.D. of three independent cultures. *, p < 0.05 (Student's t test). E, MCF-7 cells were treated with vehicle or AM580 (0.1 μm) for 48 h. Single cell random motility was monitored by time lapse microscopy for the indicated amount of time. Each value is the mean ± S.E. of at least 16 cells/experimental point. CTRL, control. F, E2-depleted MCF-7 or T47D cells (5 days) were transfected with anti-miR-21 or anti-NC along with pEGFP-N1 (containing the enhanced GFP gene) before treatment with ATRA (1 μm) or vehicle in the presence of E2 (0.01 μm). The displacement of individually tracked GFP-positive cells (mean ± S.E., at least 10 GFP-positive cells/experimental point) was measured by time lapse microscopy, starting 48 h after transfection. The results are representative of three independent experiments. All of the points of the curves corresponding to the anti-NC and ATRA + anti-NC treatments are significantly different (Student's t test, p < 0.01). G, MDA-MB-231 cells were transfected with pre-miR-21 or pre-NC along with pEGFP-N1 before treatment with ATRA (1 μm) or vehicle. Random motility was measured as in E and F. The results are representative of three independent experiments. All of the points of the curves corresponding to the pre-miR-21 and pre-NC treatments are significantly different regardless of the presence/absence of ATRA (Student's t test, p < 0.01).
FIGURE 6.
FIGURE 6.
Maspin is controlled by ATRA-dependent miR-21 induction in retinoid-responsive cells. A, effect of ATRA on the mRNA and protein levels of maspin in MCF-7 and MDA-MB-231 cells. Left panel, MCF-7 or MDA-MB-231 was treated for 6 or 48 h with vehicle or ATRA (1 μm) prior to RNA extraction and microarray analysis. The levels of maspin mRNA were determined from the whole genome gene expression microarray data set. The results are expressed in absolute fluorescence units and are the means ± S.D. of three biological replicates. Right panel, MCF-7 and MDA-MB-231 cells were treated for the indicated amount of time with vehicle or ATRA (1 μm). The same amounts of total cellular extracts (a pool of three independent cultures) were separated on SDS-PAGE and subjected to Western blot analysis with antibodies recognizing maspin (molecular mass, 40 kDa). β-Actin was used to demonstrate that identical amounts of MCF-7 and MDA-MB-231 proteins were added to each lane of the gel. B–D, the levels of maspin transcripts were determined by RT-PCR using a TaqMan assay. The results are the means ± S.D., three independent cultures. B, MCF-7, MDA-MB-231, or T47D cells were treated with 1 μm ATRA for the indicated amount of time. C, MCF-7 cells treated with 1 μm ATRA (time course). D, MCF-7 cells were treated with the indicated compounds. E, MCF-7 cells were transfected with anti-miR-21, pre-miR-21, or the negative controls, anti-NC and pre-NC, before treatment with ATRA for 72 h. The graphs indicate the results obtained by quantitative RT-PCR analysis of the maspin mRNA. The Western blots show the results obtained on the maspin protein (40 kDa). The same cell extracts were subjected to Western blot analysis with anti-maspin and anti-β-actin antibodies. Lane C shows that the maspin signal detected in MDA-MB231 cells is shown as a control to indicate that different levels of the protein are expressed in the two cell lines. The blot with β-actin (43 kDa) indicates that the same amounts of protein were loaded in each lane. All of the data are representative of at least two independent experiments. *, p < 0.05; **, p < 0.01 (Student's t test).
FIGURE 7.
FIGURE 7.
Identification of putative new miR-21 target genes. Gene expression profiling of MCF-7 and MDA-MB-231 cells treated with vehicle or 1 μm ATRA (Log2 ratio of ATRA versus vehicle). Left panel, heat map of genes whose retinoid-dependent regulation is significantly different in the two cell lines (p < 0.01) and classification in patterns consistent with miR-21 regulation (blue cluster) or not (orange cluster). Genes predicted to be target of miR-21 by Miranda, PITA, or TargetScan are indicated in light blue. Middle panel, partial blow-out of the blue cluster containing the 66 predicted and annotated targets of miR-21. Right panel, heat map of the same transcripts derived from MCF-7 cells treated with 1 μm ATRA (72 h) after transfection with anti-miR-21 or anti-NC (Log2 ratio of ATRA+anti-miR-21 versus ATRA+anti-NC). Genes belonging to inflammatory/immune responses/leukocyte migration pathways are marked in yellow.
FIGURE 8.
FIGURE 8.
Validation of selected novel miR-21 targets. A, MCF-7 or MDA-MB-231 cells were treated with ATRA (1 μm) for 48 h. Total RNA was extracted and used for the determination of the indicated transcripts by quantitative RT-PCR. The data are normalized for the content of the β-actin control RNA and are the means ± S.D. of three independent cultures. The data are representative of three independent experiments. B, 293T cells were co-transfected with pre-NC or pre-miR-21 and plasmids containing the Renilla luciferase reporter upstream of the indicated cDNA 3′-UTR. Forty-eight hours later, luciferase activity was determined. The results were normalized for the transfection efficiency using firefly luciferase. Each value is the mean ± S.D. of three replicates and is representative of three independent experiments. Deletion mutants of the miR-21 seed sequences present in the 3′-UTR of the indicated cDNAs were generated. Wild type Renilla luciferase-based constructs (hrl) or deletion mutants thereof were co-transfected with pre-miR-21 or pre-NC oligonucleotide in the presence of the normalizing firefly luciferase plasmid (pGL-3) in 293T cells. After 48 h, the luciferase activities were measured in cell extracts. The data are the means ± S.D. of three independent cultures and are representative of two independent experiments. **, significantly different (Student's t test, p < 0.01). C–E, effect of anti-miR-21 in MCF-7 and pre-miR-21 in MDA-MB-231 cells on the ATRA-dependent regulation of PLAT, IL1B, and ICAM-1 mRNAs and proteins. The cells were transfected with the indicated oligonucleotides, and the extracted RNA was subjected to RT-PCR. The results were normalized for the expression of the β-actin mRNA, are the means ± S.D. of triplicate cell cultures, and are representative of three independent experiments. **, significantly different (p < 0.01). Total protein extracts were prepared from cells treated as above and subjected to ELISA (PLAT and IL1B) Western blot or FACS (ICAM-1) analysis. PROT, protein.
FIGURE 9.
FIGURE 9.
Effect of maspin, ICAM-1, and PLAT silencing and/or overexpression on MCF-7 growth and motility in the presence and absence of ATRA. A, MCF-7 cells were transfected with the indicated siRNAs or cDNAs. Seventy-two hours after transfection, protein extracts were subjected to Western blot analysis. The same amounts of protein extracts (derived from a pool of three independent cultures) were separated on PAGE and detected by antibodies against maspin (40 kDa), ICAM-1 (90 kDa), and PLAT (68 kDa). The last panel illustrates the levels of PLAT measured with a specific ELISA assay. NS siRNA, irrelevant oligonucleotide provided by the same commercial source of the validated siRNAs that serves as a negative control in the experiments. B, left panel, MCF-7 cells were transfected with validated siRNAs targeting maspin, ICAM-1, and PLAT or the appropriate negative control NS siRNA. Cell growth was evaluated 48 h after the addition of vehicle (Me2SO) or ATRA (1 μm) by the MTT assay (mean ± S.D., six independent cultures). **, p < 0.01 (Student's t test). The results are representative of two independent experiments. Right panel, MCF-7 cells were transfected with maspin cDNA or the corresponding void vector (pcDNA3). Forty-eight hours later, cell growth was monitored by the MTT assay. **, significantly lower relative to all the other experimental groups (p < 0.01). C–E, MCF-7 cells were transfected with maspin (C), ICAM-1 (D), PLAT (E), or control siRNA (left panels) or the corresponding cDNAs (right panels) along with pEGFP-N1 (containing the enhanced GFP gene) in the presence of E2 (0.01 μm). The displacement of individually tracked GFP-positive cells (mean ± S.E., at least 15 GFP-positive cells/experimental point) was measured by time lapse microscopy, starting 48 h after transfection. The results are representative of two independent experiments. Starting from 500 min, all of the points of the curves corresponding to the ICAM-1 siRNA or maspin siRNA treatments are significantly lower than the corresponding NC siRNA points (Student's t test, p < 0.05). Starting from 500 and 1,000 min, respectively, all the points of the curves corresponding to the maspin and ICAM-1 cDNAs are significantly higher than the corresponding vector points (Student's t test, p < 0.05) in untreated MCF-7 cells. The results are representative of two independent experiments.

Similar articles

Cited by

References

    1. Garattini E., Gianni M., Terao M. (2007) Curr. Pharm. Des. 13, 1375–1400 - PubMed
    1. Garattini E., Gianni M., Terao M. (2004) Curr. Pharm. Des. 10, 433–448 - PubMed
    1. Uray I. P., Brown P. H. (2006) Expert Opin. Investig. Drugs 15, 1583–1600 - PubMed
    1. Brodersen P., Voinnet O. (2009) Nat. Rev. Mol. Cell Biol. 10, 141–148 - PubMed
    1. Gregory P. A., Bert A. G., Paterson E. L., Barry S. C., Tsykin A., Farshid G., Vadas M. A., Khew-Goodall Y., Goodall G. J. (2008) Nat. Cell Biol. 10, 593–601 - PubMed

Publication types

MeSH terms