. 2011 Feb;300(2):L266-73.
doi: 10.1152/ajplung.00239.2010. Epub 2010 Dec 3.

Chronic intermittent hypoxia induces lung growth in adult mice

Affiliations

Chronic intermittent hypoxia induces lung growth in adult mice

Christian Reinke et al. Am J Physiol Lung Cell Mol Physiol. 2011 Feb.

Abstract

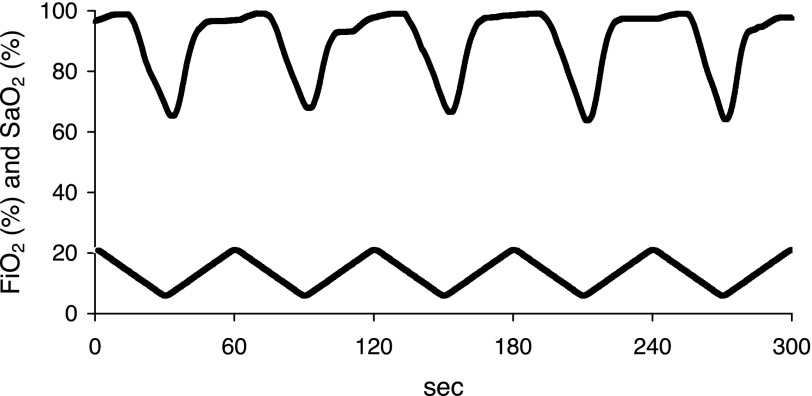
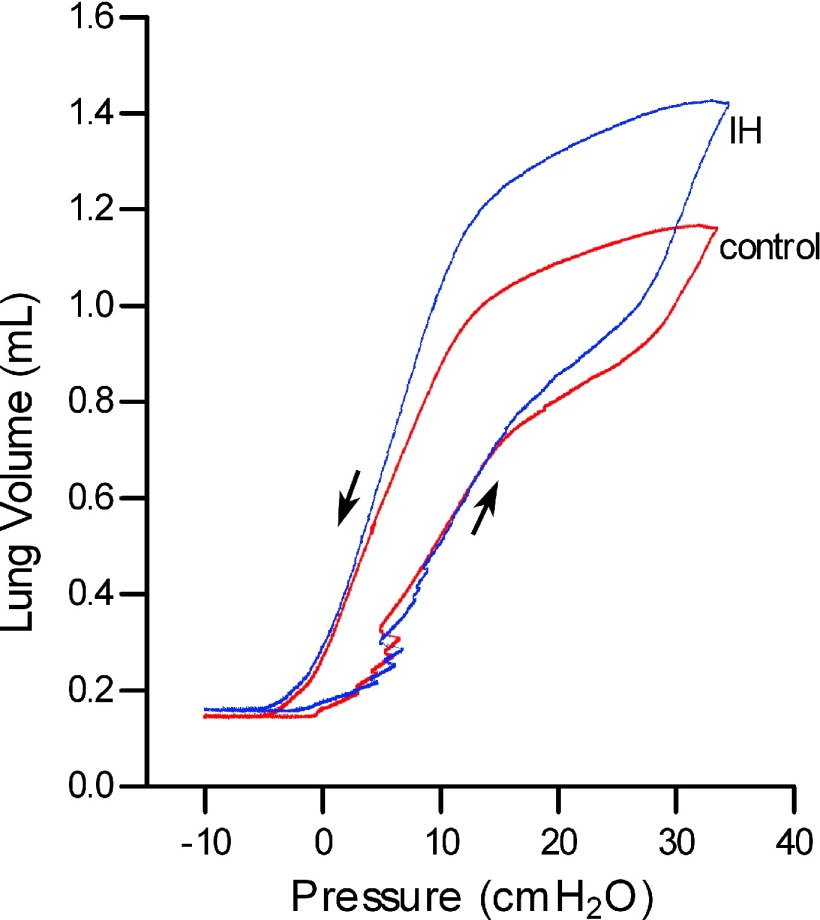
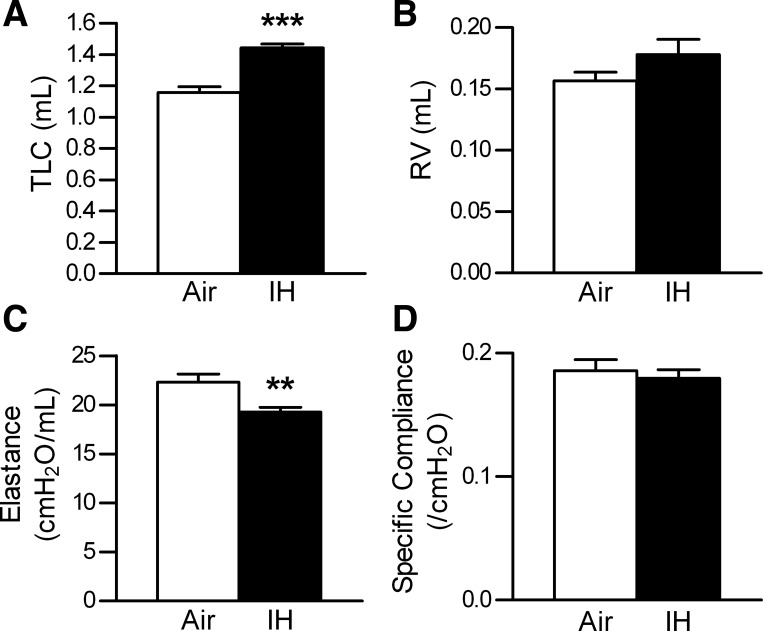
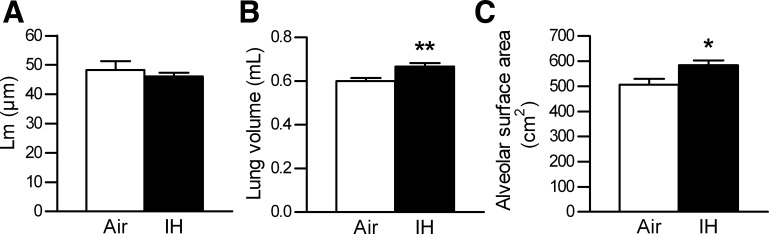
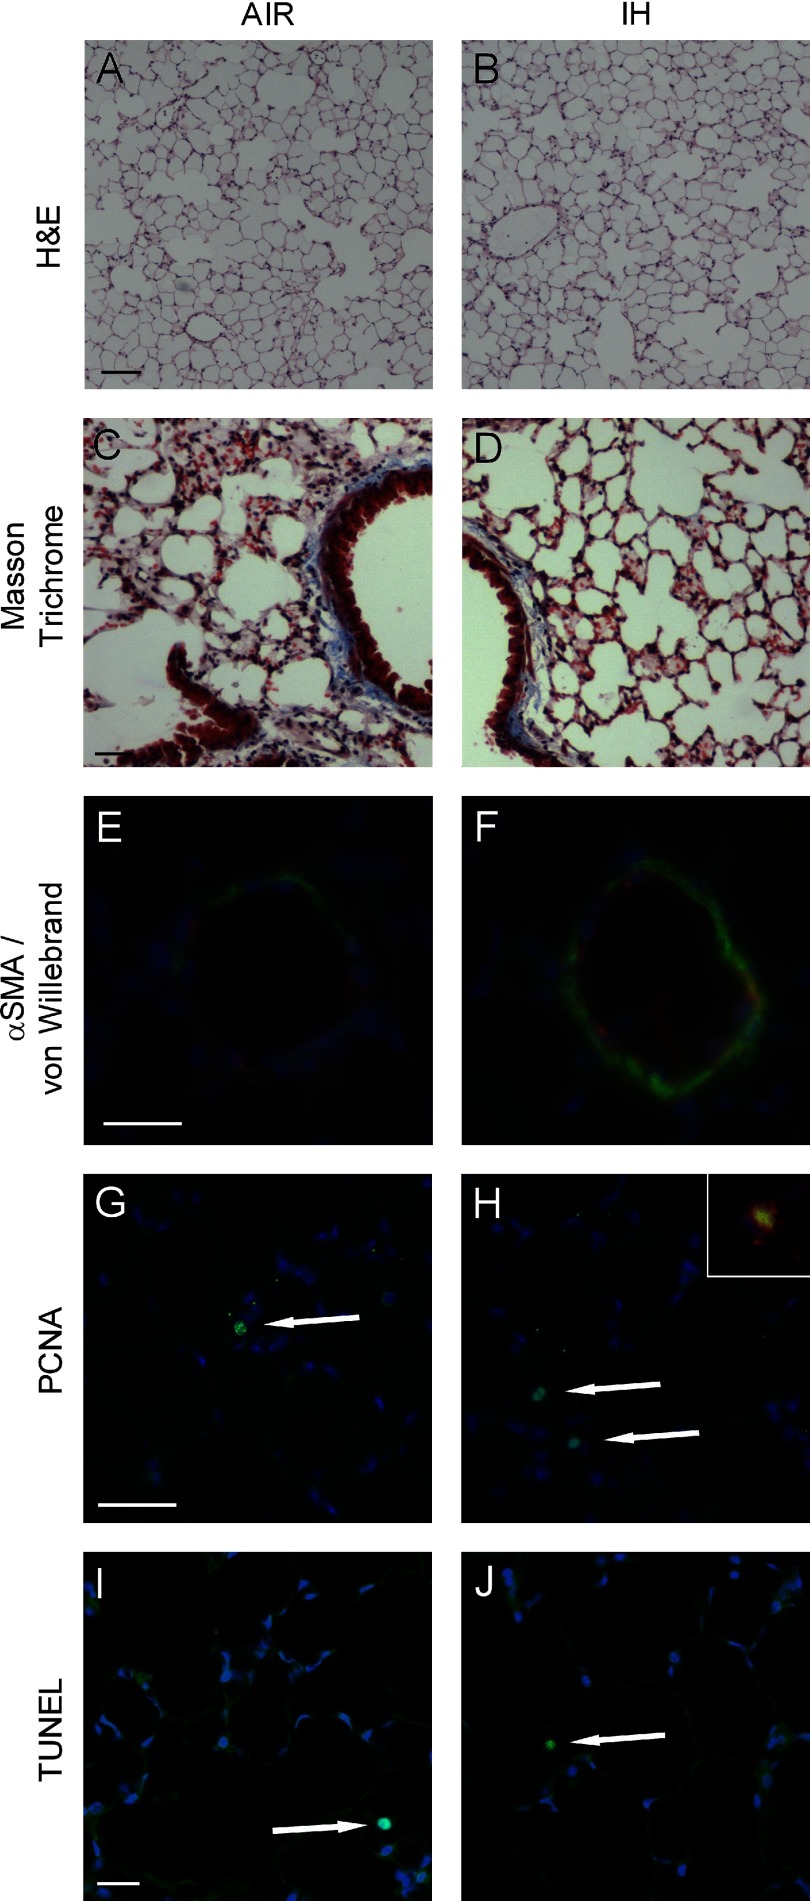
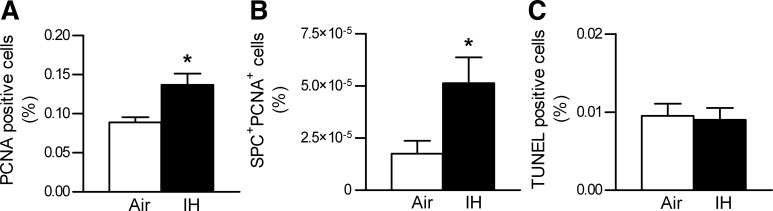
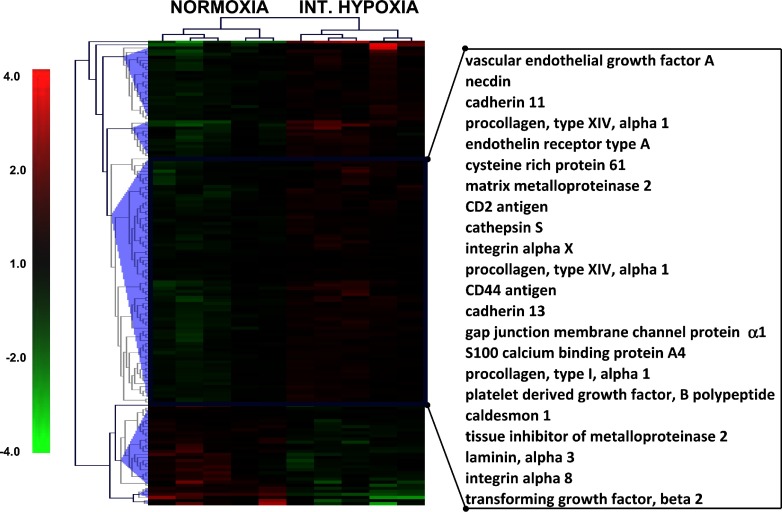
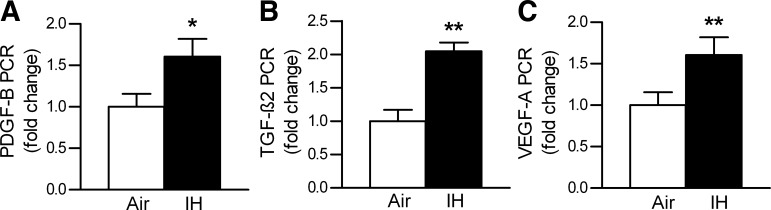
Obstructive sleep apnea (OSA) increases cardiovascular morbidity and mortality, which have been attributed to intermittent hypoxia (IH). The effects of IH on lung structure and function are unknown. We used a mouse model of chronic IH, which mimics the O(2) profile in patients with OSA. We exposed adult C57BL/6J mice to 3 mo of IH with a fraction of inspired oxygen (F(I)(O(2))) nadir of 5% 60 times/h during the 12-h light phase. Control mice were exposed to room air. Lung volumes were measured by quasistatic pressure-volume (PV) curves under anesthesia and by water displacement postmortem. Lungs were processed for morphometry, and the mean airspace chord length (Lm) and alveolar surface area were determined. Lung tissue was stained for markers of proliferation (proliferating cell nuclear antigen), apoptosis (terminal deoxynucleotidyl transferase dUTP nick-end labeling), and type II alveolar epithelial cells (surfactant protein C). Gene microarrays were performed, and results were validated by real-time PCR. IH increased lung volumes by both PV curves (air vs. IH, 1.16 vs. 1.44 ml, P < 0.0001) and water displacement (P < 0.01) without changes in Lm, suggesting that IH increased the alveolar surface area. IH induced a 60% increase in cellular proliferation, but the number of proliferating type II alveolocytes tripled. There was no increase in apoptosis. IH upregulated pathways of cellular movement and cellular growth and development, including key developmental genes vascular endothelial growth factor A and platelet-derived growth factor B. We conclude that IH increases alveolar surface area by stimulating lung growth in adult mice.


Figures

Fig. 1.
Fig. 1.
The real-time intermittent hypoxia (IH) profile. During each period of IH, the fraction of inspired oxygen (FiO2) was reduced from room air levels to 5% within 30 s, followed by a reoxygenation to room air levels within the subsequent 30 s. This protocol was used for 3 mo during the 12-h light phase. A corresponding representative SaO2 tracing from 1 mouse is shown at the top.
Fig. 2.
Fig. 2.
Representative pressure-volume curves from control mice (red) and IH mice (blue). Quasistatic pressure-volume curves were performed by inflating the lungs to a maximum pressure of 35 cmH2O, which was defined as the lung volume at full inflation (total lung capacity). Residual volume was the volume at −10 cmH2O. Functional residual capacity was the volume at 0 cmH2O.
Fig. 3.
Fig. 3.
Results of the pulmonary function testing. Values are means ± SE. A: total lung capacity (TLC). B: residual volume (RV). C: dynamic elastance. D: specific compliance; n = 9 for air, n = 10 for IH. **P < 0.01 and ***P < 0.0001.
Fig. 4.
Fig. 4.
Morphometry results of the left lung. Values are means ± SE. A: mean airspace chord length (Lm). B: left lung volume, using water displacement. C: alveolar surface area, calculated as 4 V/Lm; n = 9 for air, n = 9 for IH. *P < 0.05 and **P < 0.01.
Fig. 5.
Fig. 5.
Representative bright-field (AD) and immunofluorescence (EJ) images of the lungs. Original magnification: ×40 (A and B), ×100 (C and D), and ×400 (EJ). A and B: hematoxylin and eosin (H & E). C and D: Masson Trichrome. E and F: muscularization of small pulmonary arteries as assessed by double staining for α-smooth muscle actin (αSMA; green) and von Willebrand factor (red). Nuclei are counterstained with 4,6′-diamidino-2-phenylindole (DAPI) in blue. G and H: proliferating cell nuclear antigen (PCNA) stained in green; nuclei are counterstained with DAPI in blue. H, inset, shows a magnified PCNA positive cell, the cytoplasma of which is positive for SPC stained in red. I and J: terminal deoxynucleotidyl transferase dUTP nick-end labeling (TUNEL) staining. White arrows point to PCNA- (G and H) and TUNEL-positive cells (I and J). Scale bars for A and B are 100 μm, for C and D 40 μm, and for EJ 20 μm each.
Fig. 6.
Fig. 6.
Indices of proliferation and apoptosis in lung tissue. A: results of the PCNA staining of lung tissue, shown as %PCNA positive cells/total cells. B: results of the PCNA + surfactant protein C (SPC) double staining, shown as %SPC+ PCNA+ cells/total cells. C: results of the TUNEL staining of lung tissue, shown as %TUNEL positive cells/total cells. Values are means ± SE; n = 10 for air, n = 10 for IH. *P < 0.05.
Fig. 7.
Fig. 7.
Hierarchical clustering of genes representing cell movement pathway. The 151 genes that represent cell movement pathway as identified by Ingenuity analysis (Supplemental Fig. S1) were clustered using default settings of MeV software. Expression difference values (log2) for each gene were calculated by subtracting the average of expression values of a given gene in all tested conditions from individual gene expression value of each biological replicate. Each column represents an experimental condition of lung sample, and each row represents expression pattern of a gene throughout given experimental conditions. Hierarchical clustering conducted using Euclidian correlation (average linkage) identified 5 major clusters (blue triangles), of which 1 cluster demonstrated clear upregulation after IH. Genes from these clusters are highlighted with a blue rectangle, and the most representative are listed on the right. Red color indicates upregulation, and green color indicates downregulation of gene expression relative to combined average, with color intensity corresponding to the expression difference (scale is shown on the left).
Fig. 8.
Fig. 8.
Results of the real-time PCR in lung tissue. A: platelet-derived growth factor B (PDGF-B). B: transforming growth factor-β2 (TGF-β2). C: vascular endothelial growth factor A (VEGF-A), shown as mRNA expression levels normalized to 18s ribosomal RNA concentrations and then expressed as a ratio of IH to control. Values are means ± SE; n = 10 for air, n = 10 for IH. *P < 0.05 and **P < 0.01.

Similar articles

Cited by

References

    1. Ambalavanan N, Nicola T, Hagood J, Bulger A, Serra R, Murphy-Ullrich J, Oparil S, Chen YF. Transforming growth factor-β signaling mediates hypoxia-induced pulmonary arterial remodeling and inhibition of alveolar development in newborn mouse lung. Am J Physiol Lung Cell Mol Physiol 295: L86–L95, 2008. - PMC - PubMed
    1. Berg JT, Breen EC, Fu Z, Mathieu-Costello O, West JB. Alveolar hypoxia increases gene expression of extracellular matrix proteins and platelet-derived growth factor-B in lung parenchyma. Am J Respir Crit Care Med 158: 1920–1928, 1998. - PubMed
    1. Bishai JM, Mitzner W. Effect of severe calorie restriction on the lung in two strains of mice. Am J Physiol Lung Cell Mol Physiol 295: L356–L362, 2008. - PMC - PubMed
    1. Bixler EO, Vgontzas AN, Lin HM, Ten HT, Rein J, Vela-Bueno A, Kales A. Prevalence of sleep-disordered breathing in women: effects of gender. Am J Respir Crit Care Med 163: 608–613, 2001. - PubMed
    1. Buckley S, Driscoll B, Shi W, Anderson K, Warburton D. Migration and gelatinases in cultured fetal, adult, and hyperoxic alveolar epithelial cells. Am J Physiol Lung Cell Mol Physiol 281: L427–L434, 2001. - PubMed

Publication types

MeSH terms

Substances