. 2011 Jan 1;186(1):350-8.
doi: 10.4049/jimmunol.1003108. Epub 2010 Dec 3.

The role of germline promoters and I exons in cytokine-induced gene-specific class switch recombination

Affiliations

The role of germline promoters and I exons in cytokine-induced gene-specific class switch recombination

Wesley A Dunnick et al. J Immunol. .

Abstract

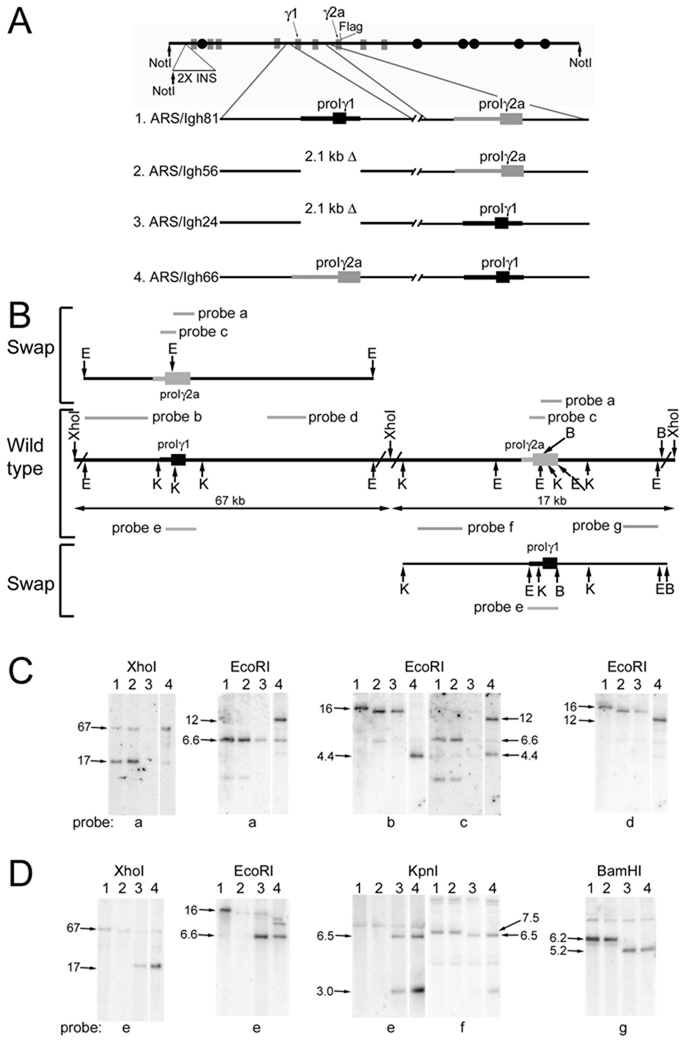
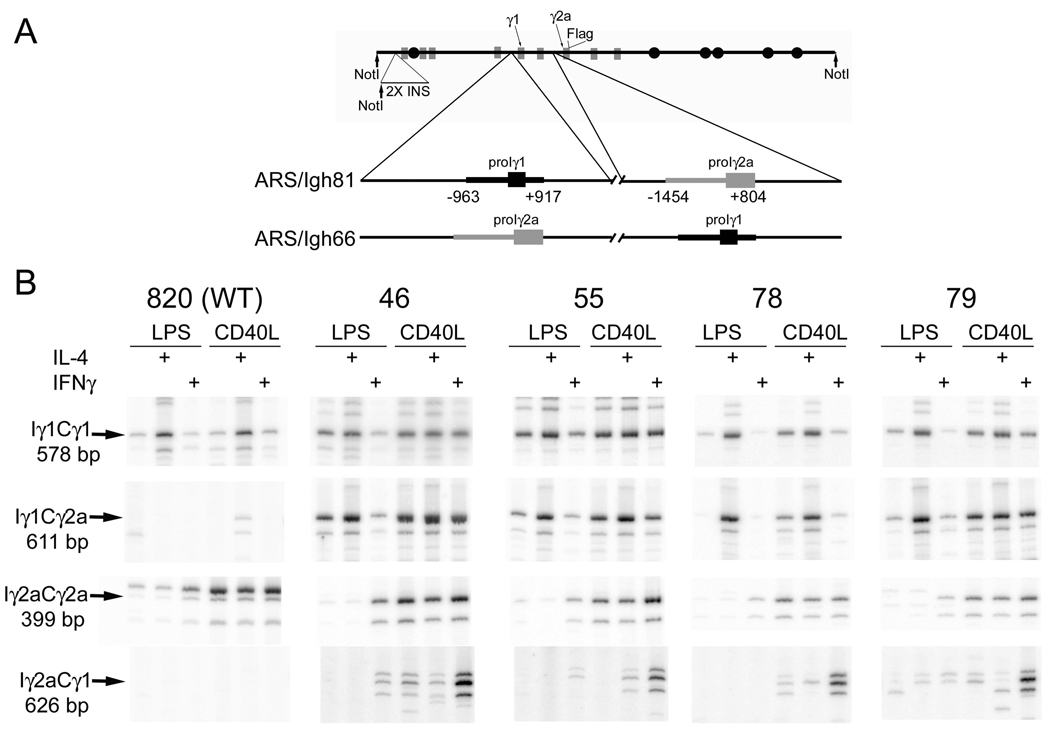
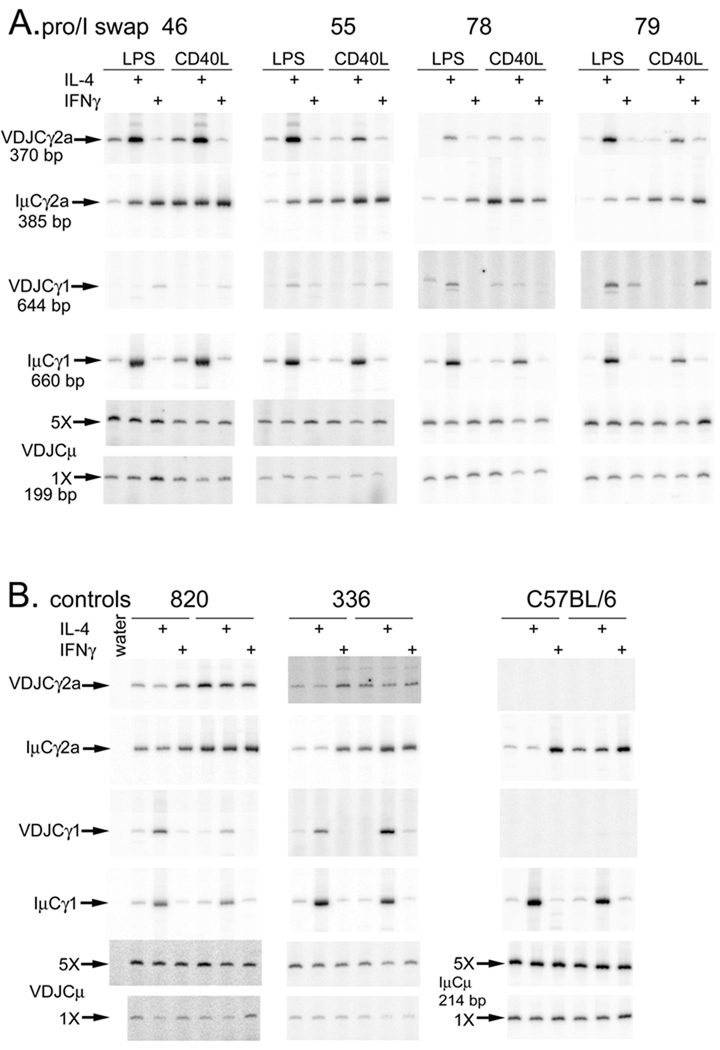
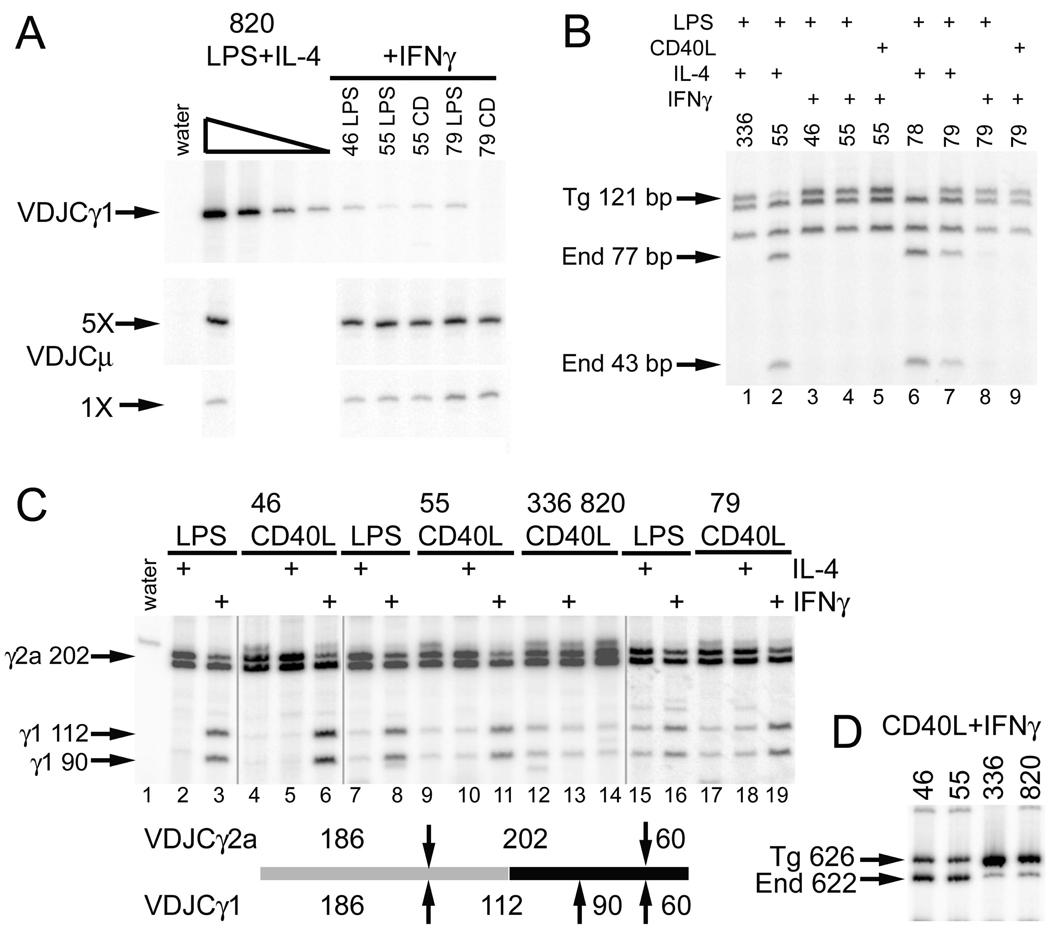
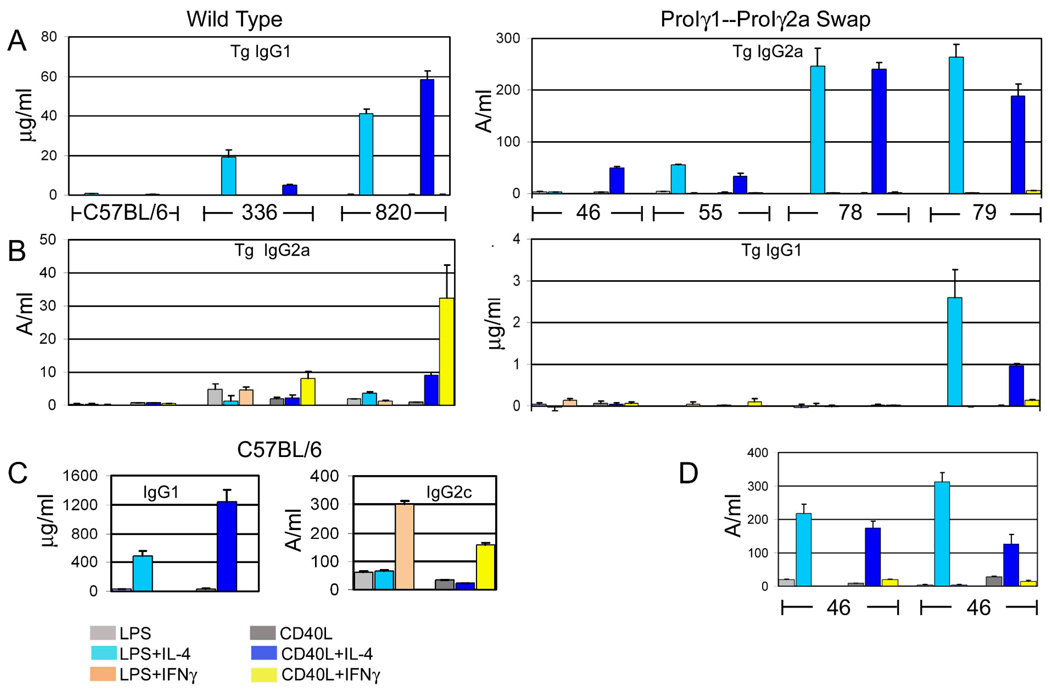
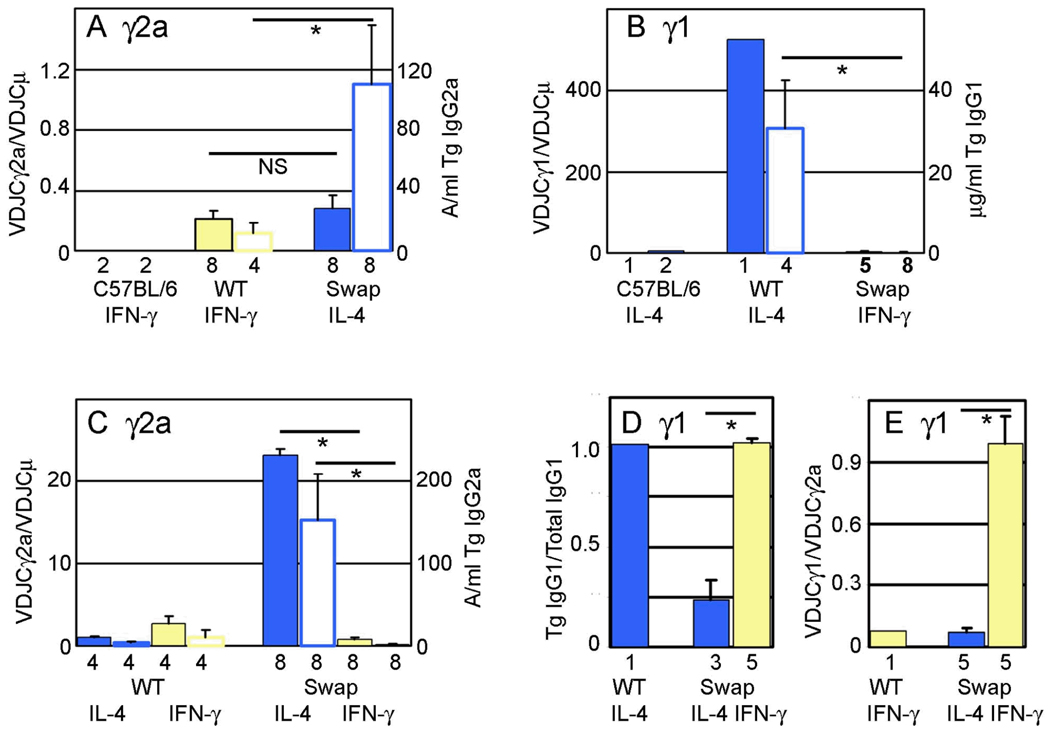
Germline transcription precedes class switch recombination (CSR). The promoter regions and I exons of these germline transcripts include binding sites for activation- and cytokine-induced transcription factors, and the promoter regions/I exons are essential for CSR. Therefore, it is a strong hypothesis that the promoter/I exons regions are responsible for much of cytokine-regulated, gene-specific CSR. We tested this hypothesis by swapping the germline promoter and I exons for the murine γ1 and γ2a H chain genes in a transgene of the entire H chain C-region locus. We found that the promoter/I exon for γ1 germline transcripts can direct robust IL-4-induced recombination to the γ2a gene. In contrast, the promoter/I exon for the γ2a germline transcripts works poorly in the context of the γ1 H chain gene, resulting in expression of γ1 H chains that is <1% the wild-type level. Nevertheless, the small amount of recombination to the chimeric γ1 gene is induced by IFN-γ. These results suggest that cytokine regulation of CSR, but not the magnitude of CSR, is regulated by the promoter/I exons.


Figures

Figure 1
Figure 1
Verification of the ARS/Igh66 gene structure. A. Construction of heavy chain constant region locus with an exchange of promoter/Iγ1 and promoter/Iγ2a. The structure of the ARS/Igh BAC is shown in the top of the figure. B. In the middle of Part B is shown the DNA around the Iγ1 and Iγ2a exons in the ARS/Igh wild type BAC. Only relevant restriction sites are shown, and some restriction sites are abbreviated: E, EcoRI; K, KpnI; B, BamHI. The locations of various probes, used in Southern hybridization experiments, are shown as grey bars with letter designations. On the upper left of Part B, a schematic depicts the location of the promoter/Iγ2a insertion into the γ1 gene. Since probes “b” and “c” are partly or wholly within the promoter/Iγ2a region, they are shown above the swapped region in their new location. On the lower right of Part B, a schematic depicts the location of the promoter/Iγ1 insertion into the γ2a gene. Since probe “a” is wholly within the promoter/Iγ1 region, it is shown below the swapped region in its new location. C and D. DNA samples (lane numbers are constructs designated in part A) were digested with the restriction enzymes listed above the panels. The XhoI digests were fractionated on a CHEF gel; other digests were fractionated on conventional 0.9% agarose gels. After blotting onto nitrocellulose, the fractionated digests were hybridized to the probes indicated below the panels. Sequences in other γ genes that are related to various probes results in weaker, cross-hybridizing fragments in some lanes. The 1.7 and 1.3 kb KpnI fragments that hybridize to probe “e” in the germline version of the locus have been run off the gel.
Figure 2
Figure 2
H chain transgene with a swap of the γ1 promoter/I exon and the γ2a promoter/I exon. A. Structure of the ARS/Igh 66 transgene. Coding regions are depicted as grey boxes and enhancer elements as black circles. A 2.4 kb fragment including two copies of the chicken β-globin insulator (“2X INS”), with an engineered NotI restriction site, was inserted 3 kb 5’ of the VDJ exon. See text for further explanation. B. Expression of chimeric germline transcripts from the ARS/Igh66 transgene. cDNA from B cell culture of the indicated transgenic lines, expression of Iγ1Cγ2a, Iγ2aCγ1 transcripts, γ2a germline transcripts, and γ1 germline transcripts. The chimeric germline transcripts were cloned and sequenced, and found to be the predicted products, with splicing from the major splice site of the Iγ1 or Iγ2a exon to the appropriate CH1 acceptor splice site (20,21). Within each transgenic line, the cDNA were first adjusted to be approximately equal for expression of transgenic VDJCμ transcripts (see Fig. 3). The slower migrating, more intense, band in the line 820 Iγ2aCγ2a panel is the transgenic germline transcripts (403 bp) from the wild type transgene. The second slowest band (399 bp) represents germline transcripts of the endogenous γ2a gene (present in all lanes), and the fastest migrating band is an alternative splice product of the γ2a germline transcripts (21).
Figure 3
Figure 3
Analysis of cytokine-induced post-switch RNA expression. cDNA from B cell cultures of the indicated transgenic lines, cultured with the indicated combinations of activators and cytokines, was tested by RT-PCR for various post-switch transcripts. Part B is arranged like Part A--within each transgenic line the left three lanes are from cells cultured with LPS and the right three lanes are from cells cultured with CD40L. Within each transgenic line, cDNAs were first adjusted to be approximately equal for expression of transgenic VDJCμ transcripts (bottom two panels for promoter/I exon swap mice—Part A, or wild type and nontransgenic mice —Part B). VDJ and Iμ transcripts were tested using the same relative amounts of cDNA. In Part B, since C57BL/6 B cells do not express transgenic transcripts, we used IμCμ transcripts to demonstrate that these samples included intact RNA.
Figure 4
Figure 4
The promoter/Iγ2a induces small amounts of IFN-γ-induced CSR to the γ1 gene. A. Quantitative comparison of VDJCγ1 expression. Samples were first balanced for VDJCμ expression (lower panels), and then tested for VDJCγ1 expression. cDNA from wild type line 820 was tested in four five-fold dilutions. B. Expression of transgenic VDJ with endogenous Cγ1. VDJCγ1 RT-PCR products were digested with Mbo1. The endogenous Cγ1 gene has an extra MboI site in CH2. C. Induction of CSR to γ1 by IFN-γ. Post-switch VDJCγ transcripts were amplified using a primer that hybridizes to both Cγ1 and Cγ2a. VDJCγ1 and VDJCγ2a were then distinguished by digestion with MboI (up or down arrows) as illustrated below the lanes. The vertical grey lines note that these data were derived from three independent RT-PCR experiments: one using the cDNA from line 46 cells activated with CD40L, with or without cytokines, one using cDNA from line 79 cells, and one using cDNA from the other samples. D. Reduced amount of Iγ2aCγ2a transcripts in B cells with the promoter/I exon swap. Germline transcripts were amplified using an Iγ2a primer and a primer that hybridizes to both Cγ1 and Cγ2a. Transgenic Iγ2aCγ1 products migrate slower than the endogenous Iγ2aCγ2a products due to a four bp insertion in the transgenic Iγ2a exon.
Figure 5
Figure 5
Analysis of secreted Ig expression. Resting splenic B cells from the indicated transgenic mice were cultured with various combinations of LPS, CD40L-expressing insect cells, IL-4, and IFN-γ. Supernatant fluids from these cultures were tested by ELISAs specific for transgenic IgG1 (A and B), transgenic IgG2a (A and B), total IgG1 (C), or total IgG2c (C). Data are presented as the means of three or four replicates from one set of cultures with SD error bars. Lines 336, 46, and 55 were tested in the same experiment; C57BL/6 and lines 820, 78, and 79 were tested in different experiments, perhaps accounting for the overall lower Ig expression in lines 336, 46, and 55. D. Transgenic Flag+ IgG2a produced by T-depleted splenocytes from line 46. The left six bars and the right six bars are from two independent experiments.
Figure 6
Figure 6
Summary of heavy chain gene expression and regulation. In Parts A, B, and C, two bars are shown for each transgenic construct for a given cytokine treatment. The filled bar of each pair presents cDNA expression data (scale on the left y axis), and the open bar of each pair presents secreted Ig data (scale on the right y axis). The mean (with SEM bars if three or more samples were included) was determined by pooling data for all lines with the same transgenic construct from both LPS and CD40L cultures. The number of data points used is shown below each bar. Statistical significance is shown by a line above two bars and an asterisk (p<0.02, Mann-Whitney two-tailed test). A. Level of expression of the γ2a gene. Normalized γ2a expression was calculated as the density (from ImageQuant analysis) of the VDJCγ2a PCR fragment divided by the density of the VDJCμ fragment for individual cDNA samples (from Supplemental Fig. 4). Data was pooled from only those cultures with the appropriate cytokine added for maximal expression, as indicated below each pair of bars. The primary data for IgG2a secretion is found in Fig. 5. B. Level of expression of the γ1 gene, calculated as in Part A. The primary data is found in Figs. 4A and 5. C. Cytokine regulation of γ2a gene expression. IL-4 induction ratios were calculated as the VDJCγ2a band density/VDJCμ band density from cultures with activator+IL-4 divided by the VDJCγ2a band density/VDJCμ band density from cultures with LPS or CD40L only (primary data in Fig. 3). IFN-γ induction ratios were calculated similarly. IL-4 and IFN-γ induction ratios for secreted IgG2a were calculated by dividing the expression level in activator + cytokine by the expression level in activator only (primary data in Fig. 5). D. Cytokine regulation of γ1 gene expression. For various mice with the same transgenic construct the ratio of transgenic VDJCγ1 to total VDJCγ1 expression was calculated from fragment densities in Fig. 4B. Means were determined for a wild type transgene (with IL-4) and for transgenes with the promoter/I exon swap (both IL-4 and IFN-γ). E. IFN-γ induction of γ1 gene expression. For various mice with the same transgenic construct the ratio of transgenic VDJCγ1 to VDJCγ2a expression was calculated from fragment densities in Fig. 4C. Means were determined for a wild type transgene (with IFN-γ) and for transgenes with the promoter/I exon swap (both IL-4 and IFN-γ).

Similar articles

Cited by

References

    1. Stavnezer J. Molecular processes that regulate class-switching. Curr.Topics Micro.Immunol. 2000;245:127–168. - PubMed
    1. Cogne M, Birshtein BK. Regulation of class switch recombination. In: Honjo T, Alt FW, Neuberger MS, editors. Molecular Biology of B Cells. London: Academic Press; 2004. pp. 289–305.
    1. Bergstedt-Lindqvist S, Sideras P, MacDonald HR, Severinson E. Regulation of Ig class secretion by soluble products of certain T-cell lines. Immun.Rev. 1989;78:25–50. - PubMed
    1. Layton JE, Vitetta ES, Uhr JW, Krammer PH. Clonal analysis of B cells induced to secrete IgG by T-cell derived lymphokines. J.Expt.Med. 1984;160:1850–1863. - PMC - PubMed
    1. Snapper CM, Paul WE. Interferon-γ and B cell stimulatory factor-1 reciprocally regulate Ig isotype production. Science. 1987;236:944–946. - PubMed

Publication types

MeSH terms