. 2011 Sep;45(3):459-69.
doi: 10.1165/rcmb.2010-0314OC. Epub 2010 Dec 3.

A single cell functions as a tissue-specific stem cell and the in vitro niche-forming cell

Affiliations

A single cell functions as a tissue-specific stem cell and the in vitro niche-forming cell

Moumita Ghosh et al. Am J Respir Cell Mol Biol. 2011 Sep.

Abstract

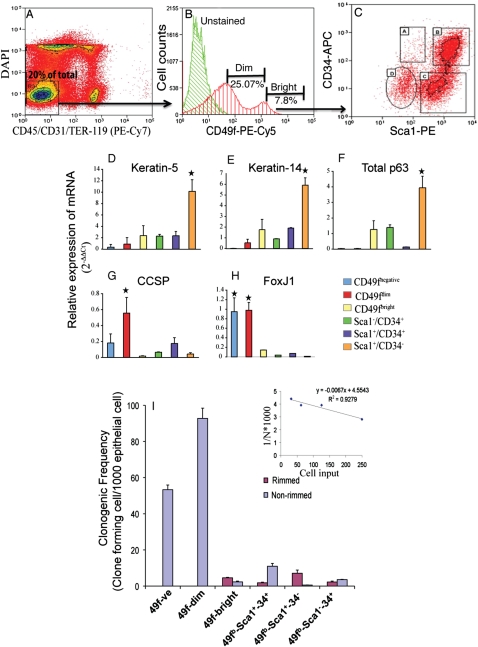
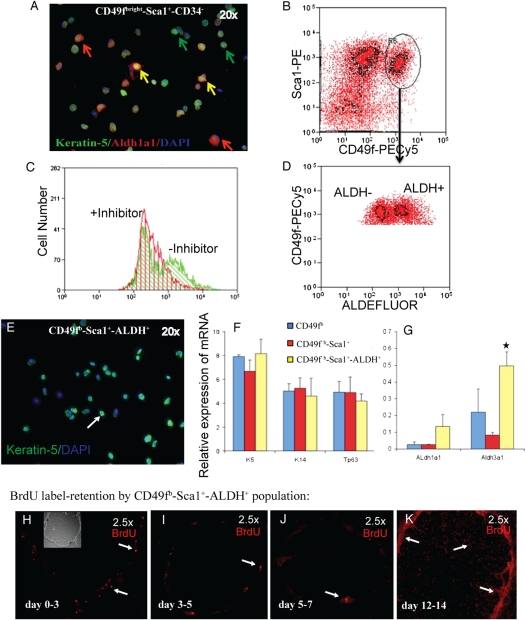
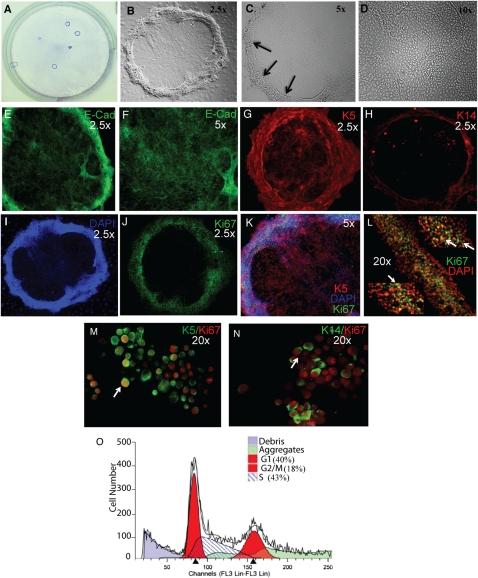
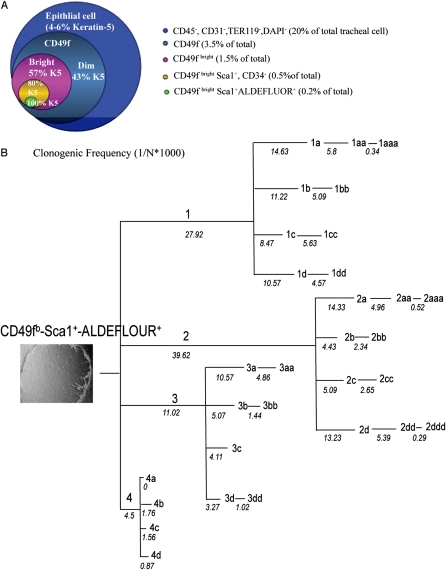
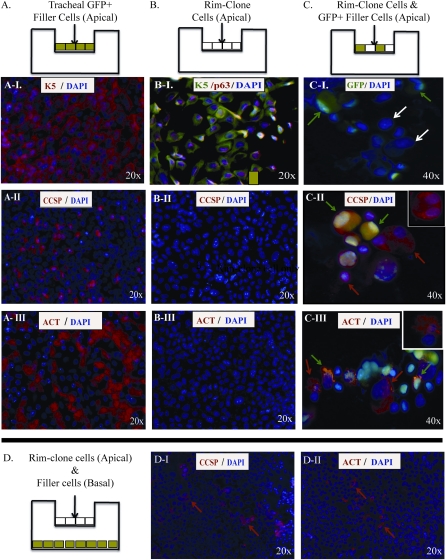
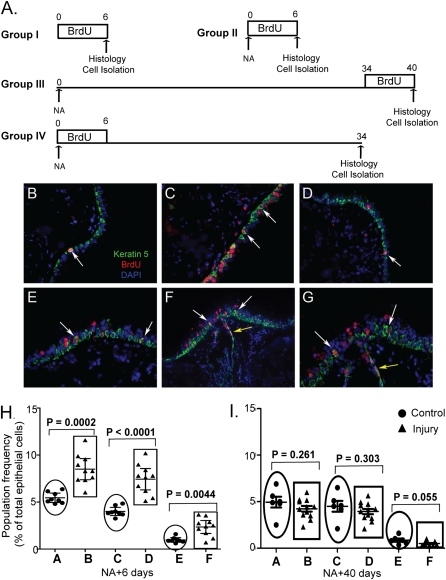
Tissue-specific stem cell (TSC) behavior is determined by the stem cell niche. However, delineation of the TSC-niche interaction requires purification of both entities. We reasoned that the niche could be defined by the location of the TSC. We demonstrate that a single CD49f(bright)/Sca1(+)/ALDH(+) basal cell generates rare label-retaining cells and abundant label-diluting cells. Label-retaining and label-diluting cells were located in the rimmed domain of a unique clone type, the rimmed clone. The TSC property of self-renewal was tested by serial passage at clonal density and analysis of clone-forming cell frequency. A single clone could be passaged up to five times and formed only rimmed clones. Thus, rimmed clone formation was a cell-intrinsic property. Differentiation potential was evaluated in air-liquid interface cultures. Homogenous cultures of rimmed clones were highly mitotic but were refractory to standard differentiation signals. However, rimmed clones that were cocultured with unfractionated tracheal cells generated each of the cell types found in the tracheal epithelium. Thus, the default niche is promitotic: Multipotential differentiation requires adaptation of the niche. Because lung TSCs are typically evaluated after injury, the behavior of CD49f(bright)/Sca1(+)/ALDH(+) cells was tested in normal and naphthalene-treated mice. These cells were mitotically active in the normal and repaired epithelium, their proliferation rate increased in response to injury, and they retained label for 34 days. We conclude that the CD49f(bright)/Sca1(+)/ALDH(+) tracheal basal cell is a TSC, that it generates its own niche in vitro, and that it participates in tracheal epithelial homeostasis and repair.


Figures

Figure 1.
Figure 1.
Rimmed clones contain label-retaining and label-diluting cells. (A and B) Colony morphology. Bright-field images of a nonrimmed (A) and rimmed (B) colony generated by unfractionated trach0065al cells. (CE) Analysis of clonality. Tracheal epithelial cells expressing green flourescent protein (GFP) or red flourescent protein (RFP) were mixed, and endogenous fluorescence was examined on culture Day 14. Merged green and red images illustrate monochromatic GFP+ (C and D) and RFP+ (E) colonies. (FJ) Label retention analysis. Tracheal cell cultures were pulsed with bromodeoxyuridine (BrdU) on culture Days 0 to 3, 3 to 5, 5 to 7, or 12 to 14 and fixed on culture Day 14. BrdU was detected by immunofluorescence analysis (red, arrows). (G) Cells that proliferated during the 0- to 3-day interval (F, J) or the 3- to 5-day interval retained label to Day 14. (H) Cells labeled between Days 5 and 7 did not retain label to Day 14. (I) Numerous cells were labeled with BrdU between Days 12 and 14. (K and L) Molecular phenotype of label-retaining cells. (K) BrdU label–retaining cells (red) coexpress keratin (K)5 (green) or (L) K14 (green). Dual-positive cells are indicated by arrows. Original magnification is noted in the upper right hand corner of each image.
Figure 2.
Figure 2.
Prospective purification of tracheal rimmed clone-forming cells. All quantitative data are presented as mean ± SD. (A) Contour plot indicating the exclusion markers used in this study: DAPI (dead cells), CD45 (hematopoietic), CD31 (endothelial), and TER-119 (erythrocytes). Viable, CD45, CD31, and TER119 cells (R3) were selected for further analysis (arrow). (B) Fractionation according to the expression CD49f (α6 integrin). Green line, unstained cells; red line, CD49f+ cells. The CD49f+ population was divided into two subsets: CD49fdim and CD49fbright. (C) Flow cytometric analysis Sca1 and CD34 expression in CD49fbright cells. The abundance of each subpopulation within the total tracheal cell preparation was (A) 0.1 ± 0.02%, (B) 1.18 ± 0.3%, (C) 0.5 ± 0.05%, and (D) 0.2 ± 0.08% (n = 5). (DH) Gene expression profile of tracheal epithelial cell subsets. Quantitative RT-PCR was used to determine the abundance of basal cell markers: K5 (D), K14 (E), total p63 (F), Clara cell secretory protein (CCSP) (G), and the ciliated cell marker FoxJ1 (H) relative to a tracheal RNA calibrator (n = 4). *Significance at P < 0.005. (G) Colony-forming cell frequency of tracheal epithelial cell subsets. Predefined numbers of cells from various subpopulations were sorted into 96-well plates containing irradiated NIH-3T3 feeders and cultured for 14 days. Two types of clones were detected: nonrimmed (blue bars) or rimmed (pink bars). Clonogenic frequency for each clone type was calculated by linear regression (inset), where N = colony-forming cell frequency, y = 1/N, and x = cell input. The equation was solved for y = 37%, and the colony forming cell frequency presented as 1,000N. Data are presented as the mean ± SD (n = 3).
Figure 3.
Figure 3.
Subsetting of CD49fbright/Sca1+ basal cells by aldehyde dehydrogenase (ALDH) activity. (A) Dual-immunofluorescence analysis of K5 (green) and ALDH1A1 (red, red arrows) in the CD49fbright/Sca1+/CD34 population. Yellow arrows indicate dual-positive cells. (B) Flow cytometric identification of CD49fbright/Sca1 dual-positive tracheal epithelial cells. Cells selected for further analysis are indicated as R6 (arrow). (C) Flow cytometric analysis of ALDEFLUOR activity in the presence of the diethylaminobenzaldehyde (DEAB) inhibitor (+inhibitor, red) and in the absence of the DEAB inhibitor (−inhibitor, green). (D) Separation of CD49fbright/Sca1+ cells into ALDH-negative (ALDH) and -positive (ALDH+) fractions. (E) Immunofluorescence analysis of cytospin preparations from CD49fbright/Sca1+/ALDH+ cells. Cells were stained for K5 (green) and DAPI (blue). Arrow indicates a typical K5+ cell. (F and G) Quantitative RT-PCR analysis of gene expression in the CD49fbright (blue), CD49fbright/Sca1+ (red), and CD49fbright/Sca1+/ALDH+ (yellow) subsets. (F) The basal cell markers K5, K14, and Trp63 were analyzed. (G) Expression of ALDH1a1 and ALDH3a1. Mean ± SD (n = 4). *Significance at P < 0.003. (HK) Proliferation of CD49fbright/Sca1+/ALDH+ cells as a function of time in culture. BrdU label (red) retention was evaluated as described in Figure 1. (H) Labeling Days 0 to 3, (I) 3 to 5, (J) 5 to 7, and (K) 12 to 14. Original magnification: 2.5×. The inset in H is a bright-field image of this clone.
Figure 4.
Figure 4.
Phenotypic characterization of rimmed clones generated by CD49fbright/Sca1+/ALDH+ cells. (A) Giemsa stain of rimmed clones in a 6-well plate. Brightfield; original magnification 1×. (BD) Phase contrast images of (B) a rimmed clone, (C) the three-dimensional rim (arrows), and (D) the cobblestone central region. Original magnifications vary for each panel and are indicated in the upper right corner. (EH) Immunofluorescence analysis of epithelial markers. (E) E-cad (green) expression in the rim. (F) E-cad expression in the cobblestone region. (G) K5 (red). (H) K14 (red). (IN) Immunofluorescence analysis of proliferation. Single-color images: (I) DAPI (blue) and (J) Ki67 (green). (K) Merged image for K5 (red), Ki67 (green), and DAPI (blue). (L) Higher magnification of Ki67 (green) and DAPI (red) at three positions within the rimmed region of a rimmed clone. Arrows indicate dual-positive cells. (M and N) Immunofluorescence analysis of (M) K5 (green) and Ki67 (red) or (N) K14 (green) Ki67 (red) on a cytospin preparation of a rimmed clone. Arrows indicate dual-positive cells. (O) Flow cytometric analysis of cell cycle position in cells derived from an individual rimmed clone. Colors are defined in the panel. Representative of 10 analyses.
Figure 5.
Figure 5.
Self-renewal properties of rimmed clone-forming cells. (A) Summary of the prospective purification strategy for tracheal basal cells. The diameter of each circle represents the abundance of each subpopulation within the original tracheal cell preparation. K5 staining of each population indicates enrichment of basal cells within the population. (B) Self-renewal of individual rimmed clone cells as a function of passage. Colony-forming cell frequency (CFCF) was determined as indicated in Figure 2. Rimmed clone (left panel), phase contrast image; original magnification 2.5×. Only rimmed clones were detected. Passage number for each clone is depicted above the line, and CFCF at each passage is noted below the line. The length of each line is proportional to the CFCF.
Figure 6.
Figure 6.
Differentiation of rimmed clone-forming cells. (AC) Schematic representing the cell types used to generate air–liquid interface (ALI) cultures. (A) Cultures generated with tracheal epithelial cells from GFP mice (GFP-filler). (B) Cultures generated with rimmed clone cells. (C) Cultures generated using a combination of GFP+ filler cells and rimmed clone cells. (A-IA-III) Immunofluorescence analysis of differentiated cell types in ALI cultures generated from GFP+ filler cells. (A-I) Expression of the basal cell marker K5 (red) and DAPI (blue). (A-II) Clara cell marker CCSP (red) and DAPI (blue). (A-III) Ciliated cell marker ACT (red) and DAPI (blue). All images are en face. Original magnification: 20×. (B-I–B-III) Immunofluorescence analysis of differentiated cell types in ALI cultures generated from rimmed clone cells. (B-I) K5 (green), p63 (red), and DAPI (blue). (B-II) CCSP (red) and DAPI (blue). (B-III) ACT (red) and DAPI (blue). All images are en face. Original magnification: 20×. (C-I–C-III) Immunofluorescence analysis of differentiated cell types in ALI cultures generated from rimmed clone cells plus GFP+ filler cells. Cells were recovered by trypsinizatin, and cytospin preparations were generated. (C-I) Endogenous GFP fluorescence (green) and DAPI (blue). Green arrows indicate GFP+ filler cells. White arrows indicate GFP clone cells. (C-II) Endogenous GFP fluorescence (green) and CCSP (red). Arrows indicate filler-derived GFP+/CCSP+ cells (green/red) and rimmed clone-derived GFP/CCSP+ cells (red). Inset illustrates a rimmed clone-derived GFP/CCSP+ cell focused on the optical plane of CCSP, a cytosolic protein. (C-III) Endogenous GFP fluorescence (green) and ACT (red). Arrows indicate filler-derived GFP+/ACT+ (green/red) cells and rimmed clone-derived GFP/ACT+ cells (red). Inset illustrates a clone-derived GFP/ACT+ focused on the optical plane ACT, an extracellular protein localized to motile cilia on the cell surface. Original magnification: 40×. (D) Analysis of paracrine signaling. Rimmed clone cells were cultured in the apical compartment and GFP+ filler cells were cultured in the basal compartment. Differentiation was evaluated 10 days after establishment of the ALI. Immunofluorescence analysis of differentiation markers in cells present on the luminal surface of the Transwell membrane, which contains the rimmed cells. All images are en face. Original magnification: 20×. (D-I) CCSP (red, arrows), DAPI (blue). (D-II) ACT (red, arrows), DAPI (blue).
Figure 7.
Figure 7.
Contribution of CD49fbright/Sca1+/ALDH+ cells in epithelial homeostasis and repair: (A) Mitotic index of CD49fbright/Sca1+/ALDH+ cells at steady state and after Naphthalene (NA) injury. Four experimental groups were used. Group I (no-injury and 6 consecutive days of BrdU), Group II (NA-injury at day 0 and 6 consecutive days of BrdU), Group III (NA-injury at day 0 and BrdU from day 34-40) and Group IV (NA-injury at day 0 followed by BrdU for 6 consecutive days and chased up to day 34). CD49fbright/Sca1+/ALDH+ cells were isolated by flow-cytometry at the end of each time-period mentioned above, cytospin preparations were generated and immunostained for BrdU. BrdU positive and negative cells were counted and expressed as percentages of total number of cells detected by DAPI staining. (B) Histological analysis of mouse trachea (group I) by immunofluorescence microscopy with anti-BrdU (red) and K5 (green) antibodies. Arrow showed a BrdU/K5 double positive cell. (C) Histology of Group II, (D) Histology of Group III. (E) Immunostaining of tracheal tissue (Group IV) showing the presence of label-retaining cells in the intercartlagenious region. Arrow showed label-retaining K5 positive cells. (F) Anatomical location of BrdU label-retaining cells (Group IV) on the surface epithelium (white arrows) and also in the submucosal gland (yellow arrow). (G) Higher magnification of the picture shown in F. (H) Participation of CD49fbright/Sca1+/ALDH+ cells in epithelial repair in response to NA-injury was assessed at day 6 post-injury by flow cytometry. Epithelial cells expressing CD49fbright (population A&B), CD49fbright/Sca1+ (population C&D) and CD49fbright/Sca1+/ALDH+ (population E&F) were analyzed. Individual animals, control group (n = 8, closed circles) and NA-treated group (n = 10, closed triangles) were evaluated and the representation of various cell subsets is presented as percentage of total epithelial cells. Differences between control and treated group were assessed by non-parametric two-tailed t test. (I) Participation of CD49fbright/Sca1+/ALDH+ cells in epithelial homeostasis on recovery day 40. Experimental design was similar to that explained in (H). Control (n = 6) and treated (n = 12).

References

    1. Morrison SJ. Stem cell potential: can anything make anything?. Curr Biol 2001;11:R7–R9 - PubMed
    1. Schofield R. The relationship between the spleen colony-forming cell and the haemopoietic stem cell. Blood Cells 1978;4:7–25 - PubMed
    1. Fuchs E. The tortoise and the hair: slow-cycling cells in the stem cell race. Cell 2009;137:811–819 - PMC - PubMed
    1. Blanpain C, Lowry WE, Geoghegan A, Polak L, Fuchs E. Self-renewal, multipotency, and the existence of two cell populations within an epithelial stem cell niche. Cell 2004;118:635–648 - PubMed
    1. Sneddon JB, Werb Z. Location, location, location: the cancer stem cell niche. Cell Stem Cell 2007;1:607–611 - PMC - PubMed

Publication types