

Contributions of the motor cortex to adaptive control of reaching depend on the perturbation schedule
- PMID: 21131448
- PMCID: PMC3116732
- DOI: 10.1093/cercor/bhq192
Contributions of the motor cortex to adaptive control of reaching depend on the perturbation schedule
Abstract
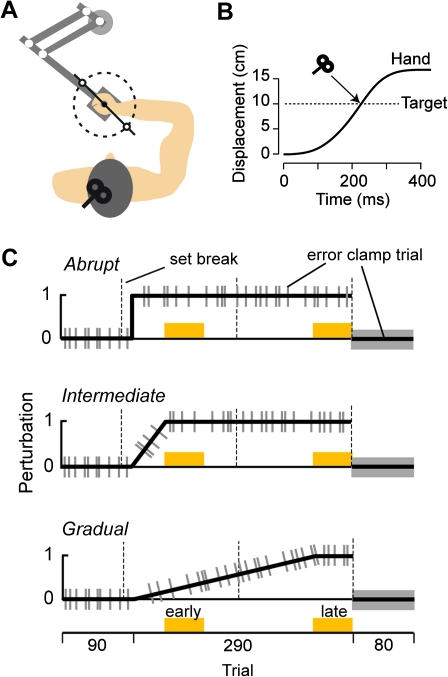
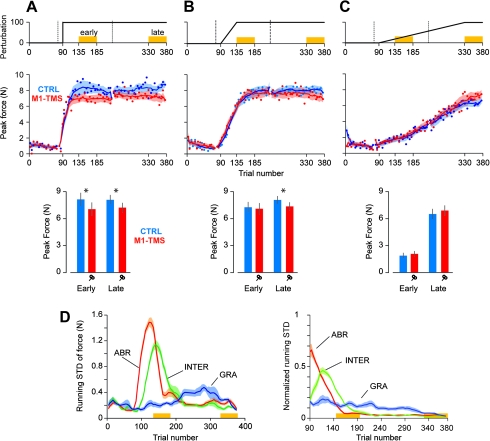
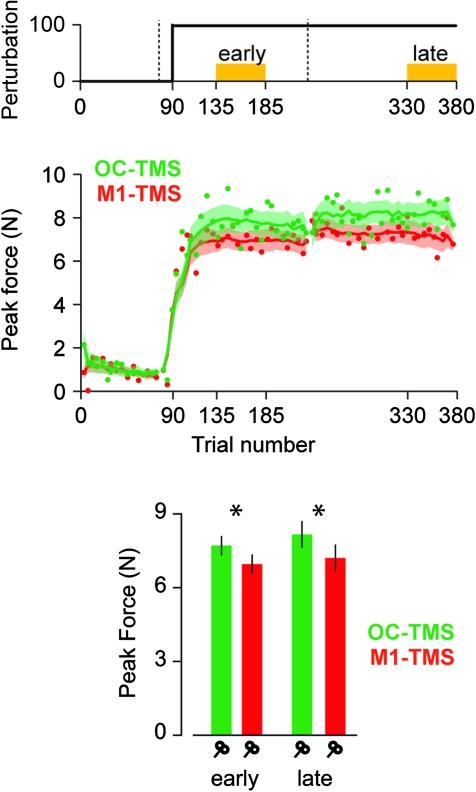
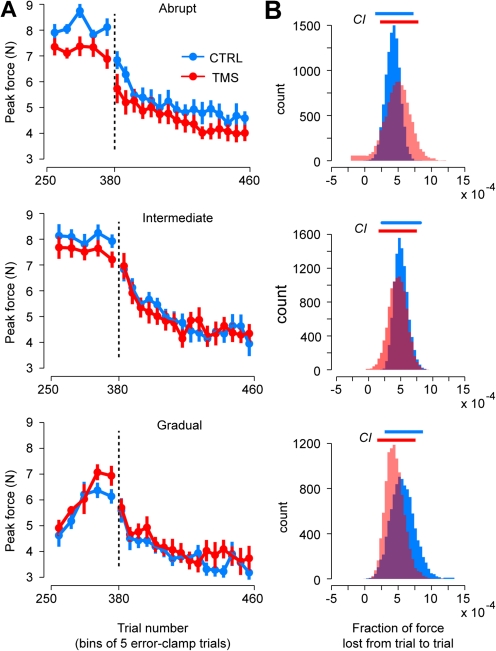
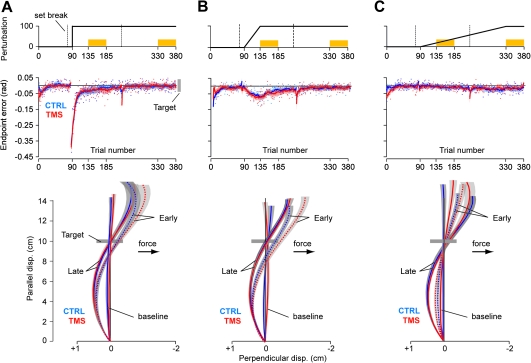
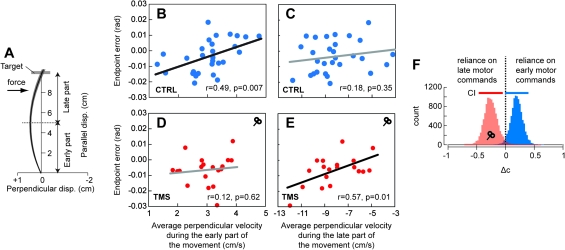
During adaptation, motor commands tend to repeat as performance plateaus. It has been hypothesized that this repetition produces plasticity in the motor cortex (M1). Here, we considered a force field reaching paradigm, varied the perturbation schedule to potentially alter the amount of repetition, and quantified the interaction between disruption of M1 using transcranial magnetic stimulation (TMS) and the schedule of perturbations. In the abrupt condition (introduction of the perturbation on a single trial followed by constant perturbation), motor output adapted rapidly and was then followed by significant repetition as performance plateaued. TMS of M1 had no effect on the rapid adaptation phase but reduced adaptation at the plateau. In the intermediate condition (introduction of the perturbation over 45 trials), disruption of M1 had no effect on the phase in which motor output changed but again impaired adaptation when performance had plateaued. Finally, when the perturbation was imposed gradually (over 240 trials), the motor commands continuously changed during adaptation and never repeated, and disruption of M1 had no effect on performance. Therefore, TMS of M1 appeared to reduce adaptation of motor commands during a specific phase of learning: when motor commands tended to repeat.
Figures
Similar articles
-
Changes in corticospinal excitability during reach adaptation in force fields.J Neurophysiol. 2013 Jan;109(1):124-36. doi: 10.1152/jn.00785.2012. Epub 2012 Oct 3. J Neurophysiol. 2013. PMID: 23034365 Free PMC article.
-
Disruption of M1 Activity during Performance Plateau Impairs Consolidation of Motor Memories.J Neurosci. 2017 Sep 20;37(38):9197-9206. doi: 10.1523/JNEUROSCI.3916-16.2017. Epub 2017 Aug 18. J Neurosci. 2017. PMID: 28821677 Free PMC article.
-
Primary motor cortex involvement in initial learning during visuomotor adaptation.Neuropsychologia. 2012 Aug;50(10):2515-23. doi: 10.1016/j.neuropsychologia.2012.06.024. Epub 2012 Jul 7. Neuropsychologia. 2012. PMID: 22781812
-
Modulation of motor performance and motor learning by transcranial direct current stimulation.Curr Opin Neurol. 2011 Dec;24(6):590-6. doi: 10.1097/WCO.0b013e32834c3db0. Curr Opin Neurol. 2011. PMID: 21968548 Review.
-
Using non-invasive brain stimulation to modulate performance in visuomotor rotation adaptation: A scoping review.Cortex. 2025 Jun;187:144-158. doi: 10.1016/j.cortex.2025.04.010. Epub 2025 Apr 30. Cortex. 2025. PMID: 40347675
Cited by
-
Motor practice related changes in the sensorimotor cortices of youth with cerebral palsy.Brain Commun. 2024 Sep 26;6(5):fcae332. doi: 10.1093/braincomms/fcae332. eCollection 2024. Brain Commun. 2024. PMID: 39391334 Free PMC article.
-
Extinction interferes with the retrieval of visuomotor memories through a mechanism involving the sensorimotor cortex.Cereb Cortex. 2015 Jun;25(6):1535-43. doi: 10.1093/cercor/bht346. Epub 2013 Dec 19. Cereb Cortex. 2015. PMID: 24363266 Free PMC article.
-
One week of motor adaptation induces structural changes in primary motor cortex that predict long-term memory one year later.J Neurosci. 2011 Aug 17;31(33):11808-13. doi: 10.1523/JNEUROSCI.2253-11.2011. J Neurosci. 2011. PMID: 21849541 Free PMC article. Clinical Trial.
-
Different modulation of oscillatory common neural drives to ankle muscles during abrupt and gradual gait adaptations.Exp Brain Res. 2022 Mar;240(3):871-886. doi: 10.1007/s00221-021-06294-3. Epub 2022 Jan 25. Exp Brain Res. 2022. PMID: 35075496
-
Probing sensorimotor memory through the human speech-audiomotor system.J Neurophysiol. 2025 Feb 1;133(2):479-489. doi: 10.1152/jn.00337.2024. Epub 2024 Dec 31. J Neurophysiol. 2025. PMID: 39740348 Free PMC article.
References
-
- Boyden E, Katoh A, Pyle J, Chatila T, Tsien R, Raymond J. Selective engagement of plasticity mechanisms for motor memory storage. Neuron. 2006;51:823–834. - PubMed
-
- Brown L, Wilson E, Gribble P. Repetitive transcranial magnetic stimulation to the primary motor cortex interferes with motor learning by observing. J Cogn Neurosci. 2009;21:1013–1022. - PubMed
