

Whole-genome sequencing and intensive analysis of the undomesticated soybean (Glycine soja Sieb. and Zucc.) genome
- PMID: 21131573
- PMCID: PMC3009785
- DOI: 10.1073/pnas.1009526107
Whole-genome sequencing and intensive analysis of the undomesticated soybean (Glycine soja Sieb. and Zucc.) genome
Abstract
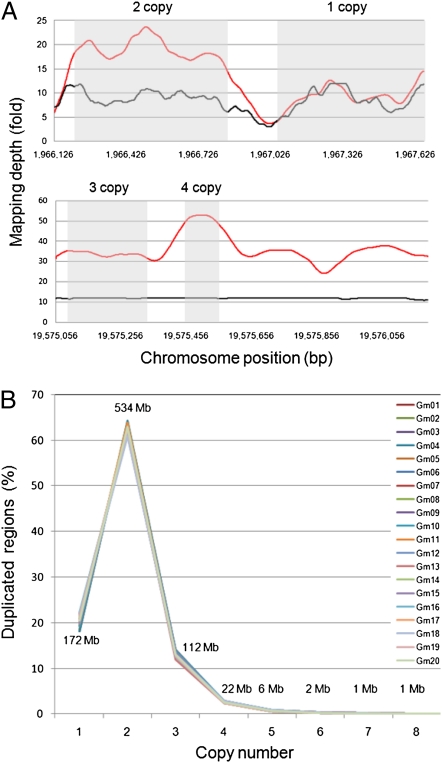
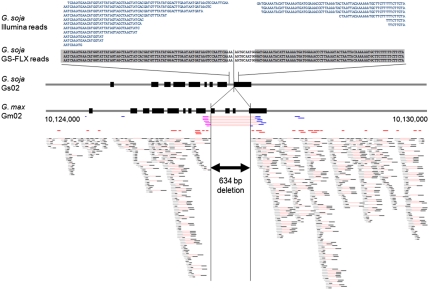
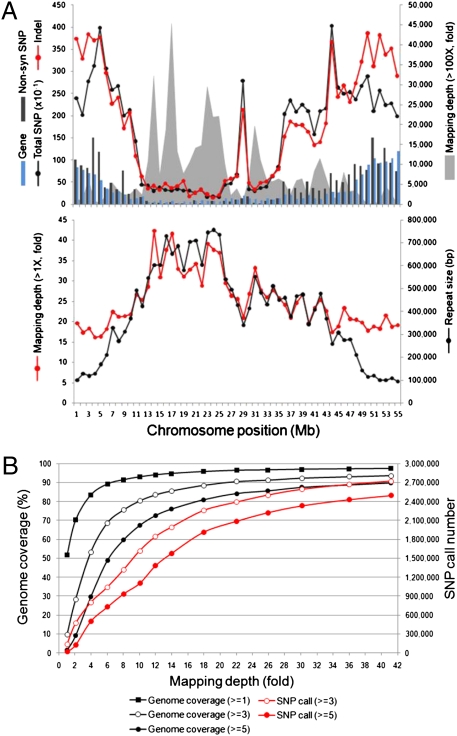
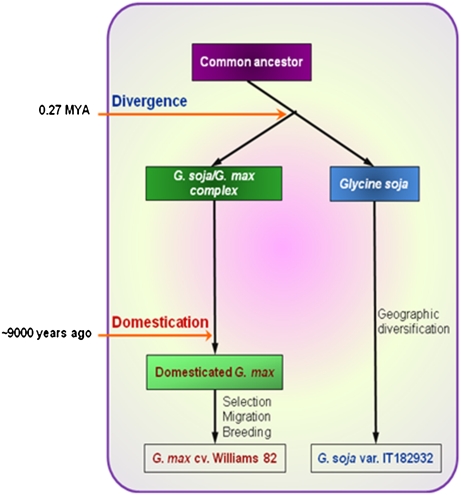
The genome of soybean (Glycine max), a commercially important crop, has recently been sequenced and is one of six crop species to have been sequenced. Here we report the genome sequence of G. soja, the undomesticated ancestor of G. max (in particular, G. soja var. IT182932). The 48.8-Gb Illumina Genome Analyzer (Illumina-GA) short DNA reads were aligned to the G. max reference genome and a consensus was determined for G. soja. This consensus sequence spanned 915.4 Mb, representing a coverage of 97.65% of the G. max published genome sequence and an average mapping depth of 43-fold. The nucleotide sequence of the G. soja genome, which contains 2.5 Mb of substituted bases and 406 kb of small insertions/deletions relative to G. max, is ∼0.31% different from that of G. max. In addition to the mapped 915.4-Mb consensus sequence, 32.4 Mb of large deletions and 8.3 Mb of novel sequence contigs in the G. soja genome were also detected. Nucleotide variants of G. soja versus G. max confirmed by Roche Genome Sequencer FLX sequencing showed a 99.99% concordance in single-nucleotide polymorphism and a 98.82% agreement in insertion/deletion calls on Illumina-GA reads. Data presented in this study suggest that the G. soja/G. max complex may be at least 0.27 million y old, appearing before the relatively recent event of domestication (6,000∼9,000 y ago). This suggests that soybean domestication is complicated and that more in-depth study of population genetics is needed. In any case, genome comparison of domesticated and undomesticated forms of soybean can facilitate its improvement.
Conflict of interest statement
The authors declare no conflict of interest.
Figures
Comment in
-
Into the wild: The soybean genome meets its undomesticated relative.Proc Natl Acad Sci U S A. 2010 Dec 21;107(51):21947-8. doi: 10.1073/pnas.1016809108. Epub 2010 Dec 13. Proc Natl Acad Sci U S A. 2010. PMID: 21149697 Free PMC article. No abstract available.
References
-
- Carter TE, Jr., Nelson R, Sneller CH, Cui Z. Genetic diversity in soybean. In: Boerma HR, Specht JE, editors. Soybeans: Improvement, Production and Uses. Madison, WI: Am Soc Agron; 2004. pp. 303–416.
-
- Zhang WK, et al. QTL mapping of ten agronomic traits on the soybean (Glycine max L. Merr.) genetic map and their association with EST markers. Theor Appl Genet. 2004;108:1131–1139. - PubMed
-
- Kang S-T, et al. Population-specific QTLs and their different epistatic interactions for pod dehiscence in soybean (Glycine max (L.) Merr.) Euphytica. 2009;166:15–24.
-
- Sasaki T, Antonio BA. Plant genomics: Sorghum in sequence. Nature. 2009;457:547–548. - PubMed
Publication types
MeSH terms
LinkOut - more resources
Full Text Sources
Other Literature Sources
Miscellaneous
