. 2011 Jan;12(1):86-95.
doi: 10.1038/ni.1965. Epub 2010 Dec 5.

Control of the differentiation of regulatory T cells and T(H)17 cells by the DNA-binding inhibitor Id3

Affiliations

Control of the differentiation of regulatory T cells and T(H)17 cells by the DNA-binding inhibitor Id3

Takashi Maruyama et al. Nat Immunol. 2011 Jan.

Abstract

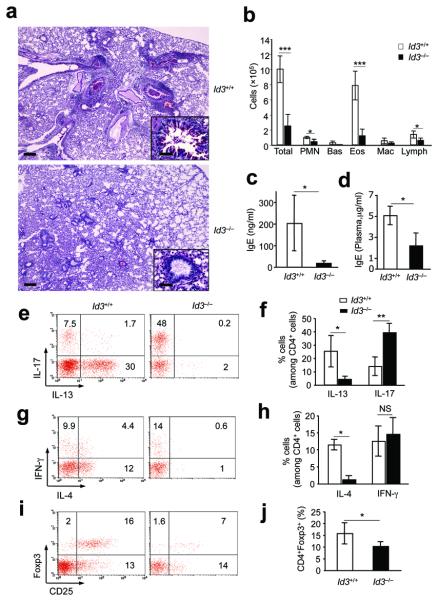
The molecular mechanisms that direct transcription of the gene encoding the transcription factor Foxp3 in CD4(+) T cells remain ill-defined. We show here that deletion of the DNA-binding inhibitor Id3 resulted in the defective generation of Foxp3(+) regulatory T cells (T(reg) cells). We identify two transforming growth factor-β1 (TGF-β1)-dependent mechanisms that were vital for activation of Foxp3 transcription and were defective in Id3(-/-) CD4(+) T cells. Enhanced binding of the transcription factor E2A to the Foxp3 promoter promoted Foxp3 transcription. Id3 was required for relief of inhibition by the transcription factor GATA-3 at the Foxp3 promoter. Furthermore, Id3(-/-) T cells showed greater differentiation into the T(H)17 subset of helper T cells in vitro and in a mouse asthma model. Therefore, a network of factors acts in a TGF-β-dependent manner to control Foxp3 expression and inhibit the development of T(H)17 cells.


Figures

Figure 1
Figure 1. Id3 regulates Foxp3+ Treg cell generation
a, Flow cytometry of CD4+CD8 T cells in the thymi and the spleens in WT (Id3+/+) and Id3−/− mice (3 weeks old). Numbers in quadrants indicate percent Foxp3+CD25 cells (top left) or Foxp3+CD25+ cells (top right). Each plot is of one mouse representative of four per group. b, Numbers indicate percent Foxp3+Helios(top left) or Foxp3+Helios+(top right) cells in CD4+CD8 T cells. c,d, Frequencies (c) and total number (d) of CD4+Foxp3+ Treg cells in the thymus (Thy) and spleens (Spl) (mean ± s.d.) of mice in a,b. (n = 7 mice). e, Id3−/− Treg cells are defective in suppressing WT T cell proliferation in cultures (mean c.p.m. ± s.d. in triplicate wells), representative of four independent experiments. White and black squares indicate the proliferation of Id3+/+ or Id3−/− Treg cells, respectively. f-h, Flow cytometry of thymocytes and splenocytes in Rag1−/− mice 4 weeks after transfer of bone marrow from Id3+/+ or Id3−/− (CD45.2+) mixed with C57BL/6 (CD45.1+) mice at a ratio of 1:2. (f) Gated CD4+CD8CD45.1 T cells in the thymi and the spleens of one mouse representative of five in each group (Rag1−/− recipients). Numbers in quadrants indicate percent Foxp3+Helios (top left) or Foxp3+Helios+ cells (top right). g,h, Frequencies (g,) and total number (h) of CD4+ Foxp3+ T cells in the thymocytes and spleens (mean ± s.d.) of mice in f. * P < 0.05; ** P < 0.01; *** P < 0.001.
Figure 2
Figure 2. Id3−/− T cells fails to generate Foxp3+ Treg cells in response to TGF-β
a, Quantitative analysis of Foxp3, present as mRNA expression relative to HPRT (mean ± s.d. of duplicate wells) in naïve CD4+CD25 T cells overnight after TCR stimulation with or without TGF-β. Data shown is of one experiment representative of at least five. b, Flow cytometry of naïve CD4+CD25 T cells cultured with TCR (with or without TGF-β) for three days. Numbers in the quadrants indicate Foxp3+ Treg cells. Each plot is of one experiment representative of five. c, Percent Foxp3+ Treg cells (mean ± s.d. of five experiments) in cultured cells in a. ** P < 0.01. d,e, Flow cytometry of CD4+CD25 T cells cultured with indicated reagents for 3-5 days. Numbers in the quadrants indicate CD25+Foxp3+ Treg cells of Id3+/+ (top row) or Id3−/− (bottom row) mice. Each plot is of one experiment representative of at least two. RA, retinoic acid.
Figure 3
Figure 3. Enrichment of E2A binding to the Foxp3 promoter
a, Schematic analysis of E protein binding sites (E-Boxes) at the Foxp3 promoter. b, Relative E2A binding ability (E47/control IgG, ChIP-qPCR assay) to the indicated E boxes in TCR and TGF-β treated CD4+CD25 T cells. E2A shows strongest binding to the E-boxes located at +327/+513. c, Analysis of relative E2A binding (E47/control IgG, ChIP-qPCR assay at +327/+513) to Foxp3 promoter in WT CD4+CD25 T cells 12-24 h after TCR stimulation with or without TGF-β. Data represent mean ± s.d. of E2A binding of four independent experiments. ** P < 0.01. d, A positive correlation between E2A binding and TBP binding to the Foxp3 promoter in WT CD4+CD25 T cells at 12-24 h after TCR and TGF-β treatment. White bar indicates the cells treated with CD3- and CD28-antibodies alone; black bar indicates plus TGF-β. Data are displayed as normalized ratios of E47/control IgG or TBP/Control IgG (mean ± s.d. of duplicate wells in one representative experiment of two, ChIP-qPCR assay at +327/513). e, Relative E2A binding ability (E47/control IgG, at +327/+513) in purified CD4+CD25+ (CD25+) Treg cells and CD4+CD25 (CD25) T cells. (mean ± s.d. of triplicate wells in one representative experiment of two).
Figure 4
Figure 4. E2A binding to the Foxp3 promoter is required for Foxp3 gene activation by TGF-β
a, Foxp3 mRNA expression relative to Hprt (mean ± s.d. of three experiments) in EL-4 LAF cells with (shRNA) or without (Scram, Scrambled-control RNA) deficiency of E2a at 12h after activation with CD3- and CD28- antibodies with or without TGF-β. The insert shows the reduction for E47 protein. b, Mutation of E-boxes in the Foxp3 construct with enhancer (left panel) reduced TGF-β-induced Foxp3 gene activity (right panel) (mean ± s.d. of the triplicate measurements in one experiment representative of three). c,d, E2af/f/Hebf/f ER-cre+ CD4+ T cells showed defect of Foxp3+ Treg cell induction to anti-CD3+CD28 and TGF-β (0.2 ng/ml). E2af/f Hebf/f Er-cre+ mice were treated with sunflower seed oil (control) or Tamoxifen and splenic CD4+CD25 T cells were cultured for 3 days. c, flow cytometry of CD4+ T cells in one representative mouse. d, frequencies of CD4+Foxp3+ Treg cells in individual mice (two independent experiments). e, Foxp3 mRNA relative to HPRT (mean ± s.d. of four samples in two experiments) in naïve CD4+CD25 T cells with (siRNA) or without (Scram) E2A deficiency after TGF-β and TCR stimulation. The insert indicates E2a mRNA reduction by siRNA. f, Deletion of Id3 blocked TGF-β-mediated enrichment of E2A binding to the Foxp3 promoter in CD4+CD25 T cells (mean ± s.d. of E2A binding in three independent experiments). n,s, not statistically significant. *P < 0.05; **P < 0.01; ***P < 0.001.
Figure 5
Figure 5. Id3 deficiency increases GATA-3
a, GATA-3 mRNA expression relative to HPRT in naïve CD4+CD25 T cells at 12 h after activation with TCR and indicated reagents (mean ± s.d. of duplicate measurements in one experiment). b, Flow cytometry of CD4+CD25 T cells at 24 h after activation. Numbers in quadrants indicate percent Foxp3+GATA-3(top left), Foxp3+GATA-3+(top right) or Foxp3GATA3+ (bottom right) cells. c, IL-4 mRNA relative to HPRT in CD4+CD25 T cells at 2 h after activation (mean ± s.d. of duplicate measurements in one representative experiment). d, Flow cytometry of Tgfbr1f/f Cd4-cre+ and Tgfbr1f/+Cd4-cre+ CD4+CD25 T cells cultured for 24 h. Numbers in quadrants indicate same cells as in (b). e, Knockdown of E2a with SiRNA decreased TCR-driven IL-4 gene expression in WT naïve CD4+CD25 T cells. IL-4 mRNA expression relative to HPRT is shown (mean ± s.d. of triplicate measurements in one representative experiment). *P < 0.05. f, Relative GATA-3 binding (GATA-3/control IgG) at the Foxp3 promoter in CD4+CD25 T cells (cultured for 24 h). Data shown are mean ± s.d. of duplicate wells in one representative experiment . g, Elimination of GATA-3 with neutralization of IL-4 (αIL-4) restored enrichment of E2A binding to the Foxp3 promoter induced by TGF-β in Id3−/− CD4+ CD25 T cells (cultured for 24 h). Data shown are mean ± s.d. of duplicate wells in one representative experiment. Data shown in a,b,c,d are one experiment representative of at least three, and in e,f,g representative of two.
Figure 6
Figure 6. Id3−/− CD4+ T cells differentiate into Th17 cells in response to TGF-β in vitro
a,b, Flow cytometry of CD4+ T cells in the lamina propia (LP) and Peyer's patches (PP) in mice (7-8-weeks old). (a) Quadrants indicate frequency (%) of intracellular IL-17+ (left) or mean fluorescence intensity (MFI) of IL-17+ (right) cells in gated CD4+ T cells in a representative mouse in each group. (b) Absolute number of IL-17+CD4+ cells (mean ± s.d, n = 3 mice) in LP and PP. Data representative of three independent experiments. c, Flow cytometry of naïve CD4+ CD25 T cells ( 3-5 weeks-old) cultured with TCR stimulation with the indicated reagents for 3-5 days. Quadrants indicate percent CD4+ versus intracellular IL-17+ cells in one experiment representative of more than five. d, ELISA analysis of cytokines in 72-h culture supernatants of CD4+CD25 T cells. Data represent mean ± s.d. of IL-17 in four independent experiments, except for IL-6 treatment (two experiments).. e, Neutralization of endogenous IL-4 abrogates TGF-β induced IL-17 production in Id3−/− naïve CD4+ T cells. Data shown indicate mean ± s.d. of quadrant measurements in two independent experiments. f, Quantitative RT-PCR analysis of RORγt, presented as mRNA expression relative to HPRT in CD4+CD25 T cells at 48 h after activation with TCR and indicated cytokines. Data shown represent one of three independent experiments. * P < 0.05; ** P < 0.01; n.s., not statistically significant
Figure 7
Figure 7. Id3 regulates Th17 cells in HDM-induced asthma
a, Mucus production in airways and inflammation in lungs in one mouse representative of nine to ten mice (PAS staining, Scale bar, 1000μm) in each group. The insert is an enlarged illustration of indicated areas (red star, Scale bar, 250 μm). b, Numbers of inflammatory cells in BAL 4 days after last i.t. challenge with HDM (mean ± s.d. of cell numbers in four mice each group). c,d, ELISA analysis of IgE in BAL (c, mean± s.d. of IgE in 4 mice per group) or plasma (d, mean ± s.d. of IgE in 6-9 mice per group). e-h, Flow cytometry of intracellular expression of IL-17, IL-13, IFN-γ and IL-4 in CD4+ T cells in BAL. e,g, Each plot is of one mouse representative of ten (Id3+/+) or nine (Id3−/−) mice. f,h, mean ± s.d. of the data in e,g, respectively. i, Flow cytometry of gated CD4+ T cells, presented as CD25 versus intracellular Foxp3 in one mouse representative of nine to ten mice in each group. j, Mean ±s.d. of the data in (i). * P < 0.05; ** P < 0.01; *** P <0.001; n.s, not statistically significant. Data represent three independent experiments.

Comment in

References

    1. Bluestone JA, Abbas AK. Natural versus adaptive regulatory T cells. Nature reviews. 2003;3:253–257. - PubMed
    1. Fontenot JD, Rudensky AY. A well adapted regulatory contrivance: regulatory T cell development and the forkhead family transcription factor Foxp3. Nature immunology. 2005;6:331–337. - PubMed
    1. Sakaguchi S. Regulatory T cells: key controllers of immunologic self-tolerance. Cell. 2000;101:455–458. - PubMed
    1. Shevach EM. CD4+ CD25+ suppressor T cells: more questions than answers. Nature reviews. 2002;2:389–400. - PubMed
    1. von Boehmer H. Mechanisms of suppression by suppressor T cells. Nature immunology. 2005;6:338–344. - PubMed

Publication types

MeSH terms

Substances