. 2011 Jan;18(1):27-34.
doi: 10.1038/nsmb.1934. Epub 2010 Dec 5.

Transcription of functionally related constitutive genes is not coordinated

Affiliations

Transcription of functionally related constitutive genes is not coordinated

Saumil J Gandhi et al. Nat Struct Mol Biol. 2011 Jan.

Abstract

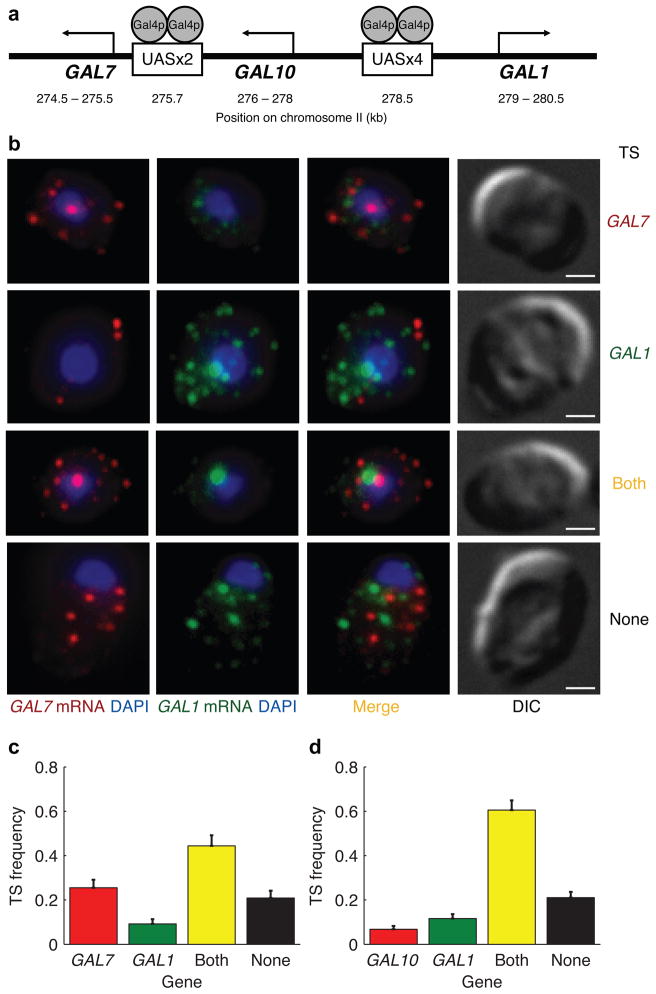
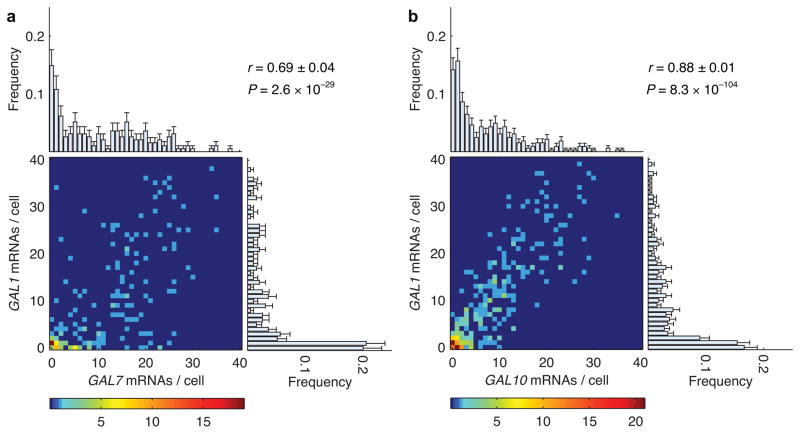
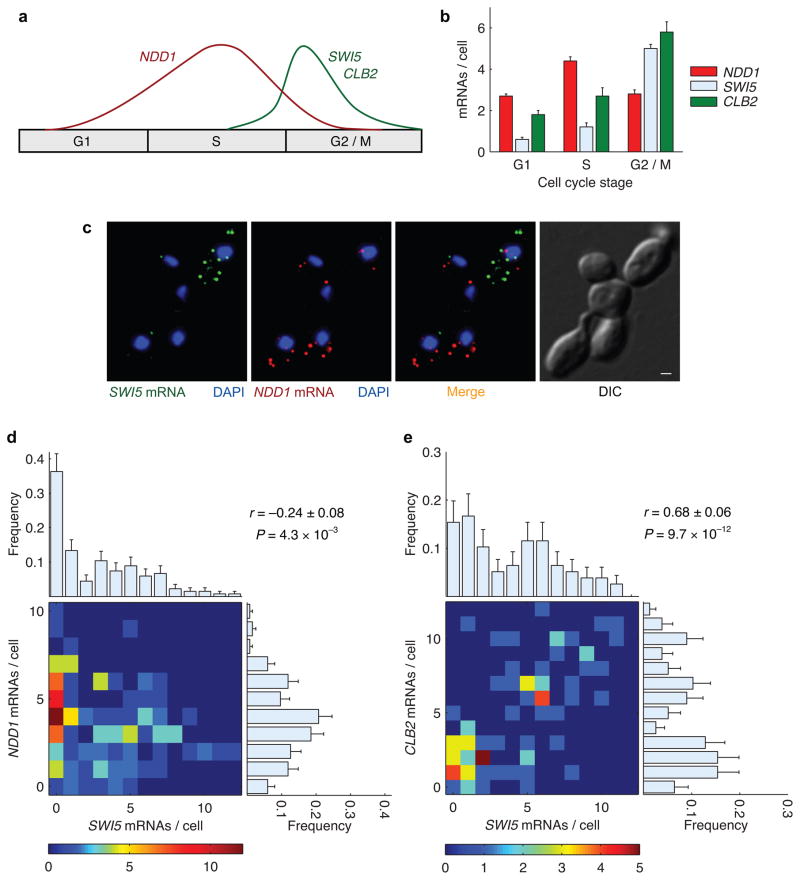
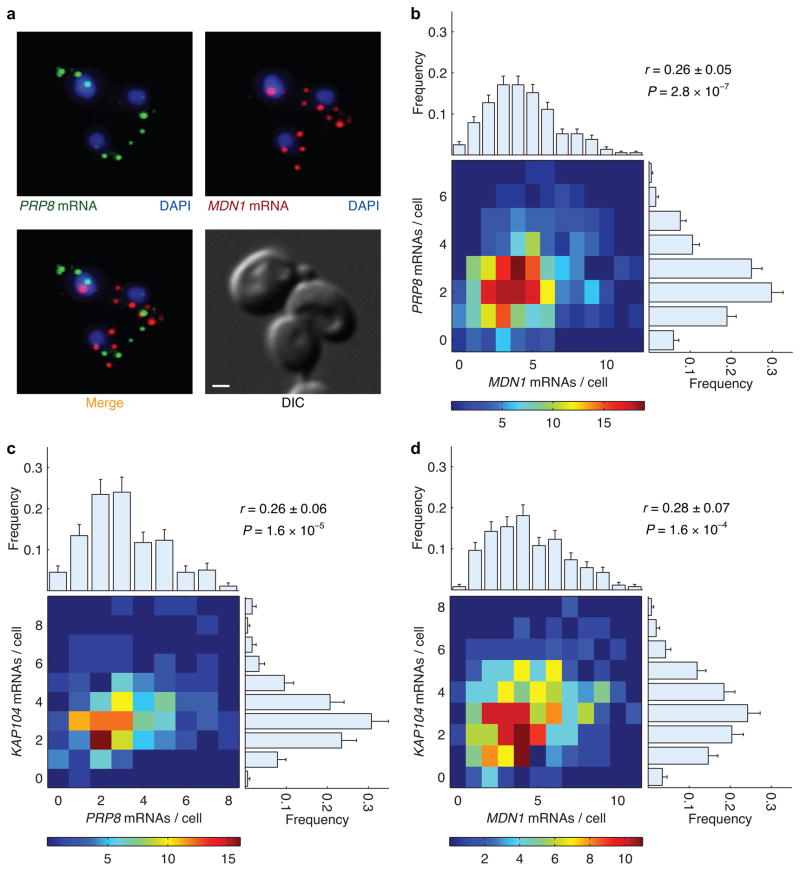
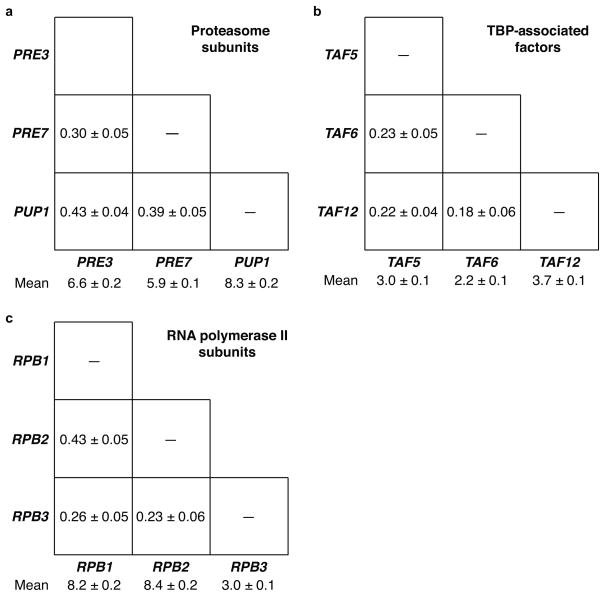
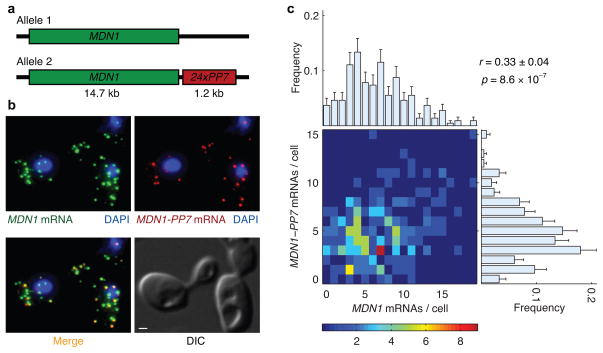
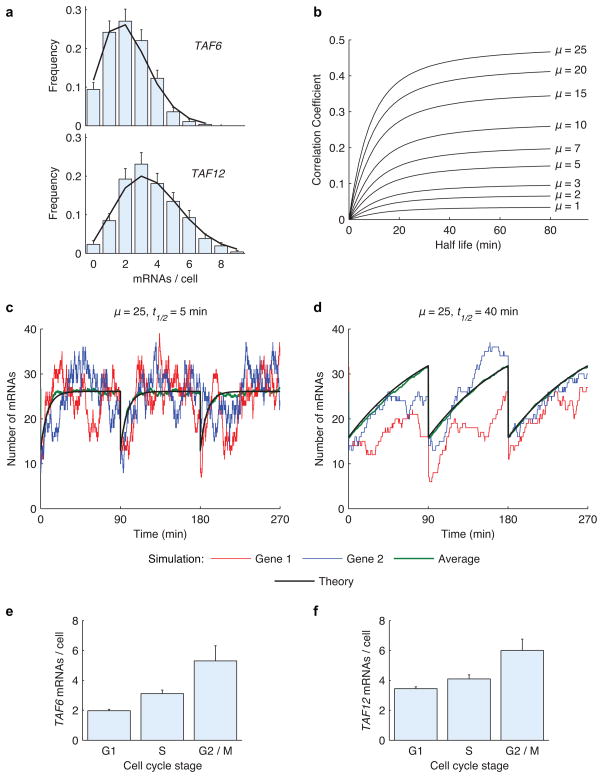
Expression of an individual gene can vary considerably among genetically identical cells because of stochastic fluctuations in transcription. However, proteins comprising essential complexes or pathways have similar abundances and lower variability. It is not known whether coordination in the expression of subunits of essential complexes occurs at the level of transcription, mRNA abundance or protein expression. To directly measure the level of coordination in the expression of genes, we used highly sensitive fluorescence in situ hybridization (FISH) to count individual mRNAs of functionally related and unrelated genes within single Saccharomyces cerevisiae cells. Our results revealed that transcript levels of temporally induced genes are highly correlated in individual cells. In contrast, transcription of constitutive genes encoding essential subunits of complexes is not coordinated because of stochastic fluctuations. The coordination of these functional complexes therefore must occur post-transcriptionally, and likely post-translationally.


Figures

Figure 1
Figure 1
Highly coordinated transcription of genes in the galactose network. (a) Schematic diagram of the organization of three GAL genes and their promoters on chromosome II. (b) Nascent transcripts at the transcription site (TS) in the nucleus and individual transcripts in the cytoplasm detected with single mRNA FISH. GAL7 mRNA (red) and GAL1 mRNA (green) were detected in the same cell with cyanine 3 and cyanine 3.5 labeled probes, respectively. DAPI (blue) was used to demarcate the nucleus. Differential interference contrast (DIC) images are shown in the last column. The scale bars are 1 μm. (c) Fraction of cells exhibiting four different modes of transcription shown in (b). Fraction of 196 cells with active transcription sites for only GAL7 (red), only GAL1 (green), both genes (yellow), and neither genes (black). (d) The same pair-wise analysis of GAL10 and GAL1 transcription sites in 309 cells. Error bars indicate s.e.m.
Figure 2
Figure 2
Correlation between cytoplasmic mRNA abundance of GAL genes in individual cells. (a) Heat map of number of GAL7 and GAL1 mRNAs in 195 individual cells. The color of each point indicates the number of cells observed at that value as specified by the color bar at the bottom. The marginal histograms represent the frequency of GAL7 mRNAs per cell (top) and GAL1 mRNAs per cell (right) across the entire population. The expression of GAL7 (top) ranged between 0 and 40 mRNAs per cell with a mean (μGAL7) of 10.6±0.7 and a standard deviation (σGAL7) of 9.9 transcripts. The expression of GAL1 (right) ranged between 0 and 40 mRNAs per cell with μGAL1 = 9.0±0.7 and σGAL1 = 11.1. The correlation (r) between transcripts of these two genes in the same cell was 0.69±0.04. (b) Pair-wise correlation between the number of GAL10 and GAL1 transcripts in 325 cells. Marginal histograms: μGAL10 = 7.6±0.5, σGAL10 = 8.1 (top); μGAL1 = 9.2±0.5, σGAL1 = 10.4 (right). Error bars indicate s.e.m.
Figure 3
Figure 3
Anti-correlation between cytoplasmic mRNA abundance of genes expressed during different cell cycle stages. (a) Cartoon of expression profile for NDD1 and its target genes SWI5 and CLB2 across different stages of the cell cycle. (b) Experimentally measured average mRNA abundance of NDD1, SWI5, and CLB2 across three different stages of the cell cycle. (c) Representative FISH images of mRNAs of the transcriptional activator NDD1 (red) and its target gene SWI5 (green) in an asynchronous population of cells. The nuclei are marked with DAPI (blue). The scale bar in the DIC image of cells is 1 μm. (c) NDD1 and SWI5 transcripts are anti-correlated in a subset of cells that excludes G1 cells. The distribution of mRNAs per cell for each gene across the population is depicted by the marginal histograms: μSWI5 = 2.9±0.3, σSWI5 = 2.9 (top); μNDD1 = 3.6±0.3, σNDD1 = 2.1 (right). (d) SWI5 and CLB2 mRNAs, expressed during the same cell cycle stage, are highly correlated in a subset that excludes G1 cells. Marginal histograms: μSWI5 = 4.1±0.4, σSWI5 = 3.4 (top); μCLB2 = 4.7±0.4, σNDD1 = 3.4 (right). Error bars indicate s.e.m.
Figure 4
Figure 4
Correlation between cytoplasmic mRNA abundance of functionally unrelated constitutively active genes. (a) Representative FISH images of mRNAs of two functionally unrelated genes, PRP8 (green) and MDN1 (red), are shown along with the DIC image of cells. The nuclei are marked with DAPI (blue). The scale bar is 1 μm. (b) Heat map of number of MDN1 and PRP8 transcripts in 369 cells. The correlation (r) between transcripts of these two genes in the same cell was 0.26±0.05. The distribution of mRNAs per cell for each gene across the population is depicted by the marginal histograms: μMDN1 = 4.3±0.1, σMDN1 = 2.4 (top); μPRP8 = 2.5±0.1, σPRP8 = 1.4 (right). (c) Pair-wise correlation between PRP8 and KAP104 in 179 cells. Marginal histograms: μPRP8 = 3.1±0.2, σPRP8 = 1.8 (top); μKAP104 = 3.3±0.2, σKAP104 = 1.5 (right). (d) Correlation between MDN1 and KAP104 in 260 cells. Marginal histograms: μMDN1 = 4.4±0.1, σMDN1 = 2.4 (top); μKAP104 = 3.1±0.1, σKAP104 = 1.6 (right). Error bars indicate s.e.m.
Figure 5
Figure 5
Correlation between cytoplasmic mRNA abundance of essential genes encoding subunits of multi-protein complexes. (a) Mean abundance and pair-wise correlation coefficients for transcripts of three genes encoding β-subunits of the proteasome 20S core particle. (b) Correlation coefficients for three genes encoding TATA binding protein associated factors involved in transcription initiation. (c) Correlation between three genes encoding subunits of RNA polymerase II. Errors indicate s.e.m.
Figure 6
Figure 6
Correlation between transcripts from two alleles of a constitutively active gene, MDN1, in diploid cells. (a) Schematic diagram of the PP7 array inserted in the 3′ untranslated region of one of the two endogenous MDN1 alleles. (b) Transcripts from both alleles were detected with cyanine 3 labeled probes hybridizing to the coding region of MDN1 (green). Transcripts from Allele 2 (yellow) were distinguished with colocalizing signals from cyanine 3.5 labeled probes against 11 binding sites in the 24x PP7 array (red). The scale bar in the DIC image is 1 μm. (c) Heat map of number of transcripts from two MDN1 alleles in 217 diploid cells. The correlation coefficient (r) between transcripts from two alleles in the same cell was 0.33±0.04. The distribution of mRNAs per cell for each allele across the population is depicted by the marginal histograms: μMDN1 = 6.6±0.3, σMDN1 = 4.0 (top); μMDN1-PP7 = 4.8±0.3, σMDN1-PP7 = 2.8 (right). Error bars indicate s.e.m.
Figure 7
Figure 7
Stochastic model predicts correlation coefficients from mean mRNA abundance and half-life times. (a) TAF6 and TAF12 mRNA distributions determined by FISH (blue bars) and analytical theory (black line). (b) Correlation coefficient as a function of mRNA half-life for various abundance levels. The analytical solution was obtained by solving the master equation. (c–d) Response to perturbation in the number of mRNAs due to cell division depends on the mRNA half-life. Gene 1 (red) and Gene 2 (blue) are simulated Monte Carlo time traces of transcript abundances for two genes in a single cell over three cell cycles. Analytical solution (black) is plotted along with the average of 100 simulations (green). (e–f) Experimentally measured average mRNA abundance of TAF6 and TAF12 across three different stages of the cell cycle. Error bars indicate s.e.m.

Similar articles

Cited by

References

    1. Gavin AC, et al. Proteome survey reveals modularity of the yeast cell machinery. Nature. 2006;440:631–6. - PubMed
    1. Krogan NJ, et al. Global landscape of protein complexes in the yeast Saccharomyces cerevisiae. Nature. 2006;440:637–43. - PubMed
    1. Gavin AC, et al. Functional organization of the yeast proteome by systematic analysis of protein complexes. Nature. 2002;415:141–7. - PubMed
    1. Holstege FC, et al. Dissecting the regulatory circuitry of a eukaryotic genome. Cell. 1998;95:717–28. - PubMed
    1. Lee TI, et al. Transcriptional regulatory networks in Saccharomyces cerevisiae. Science. 2002;298:799–804. - PubMed

Publication types

MeSH terms

Substances

LinkOut - more resources