

High content screening for non-classical peroxisome proliferators
- PMID: 21132080
- PMCID: PMC2995584
- DOI: 10.2147/IJHTS.S10547
High content screening for non-classical peroxisome proliferators
Abstract
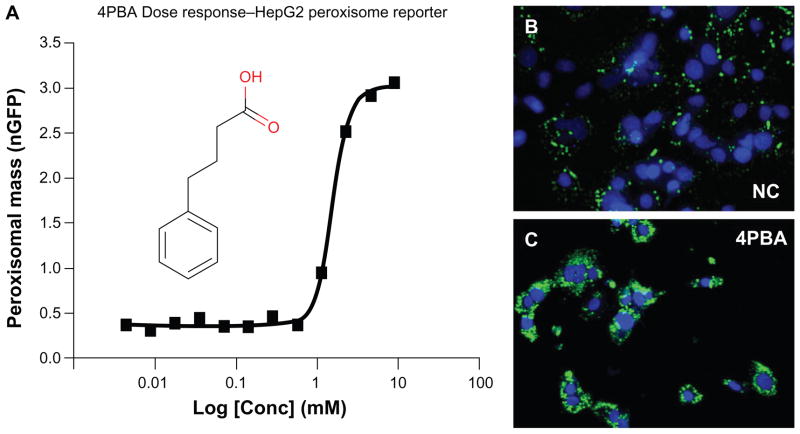
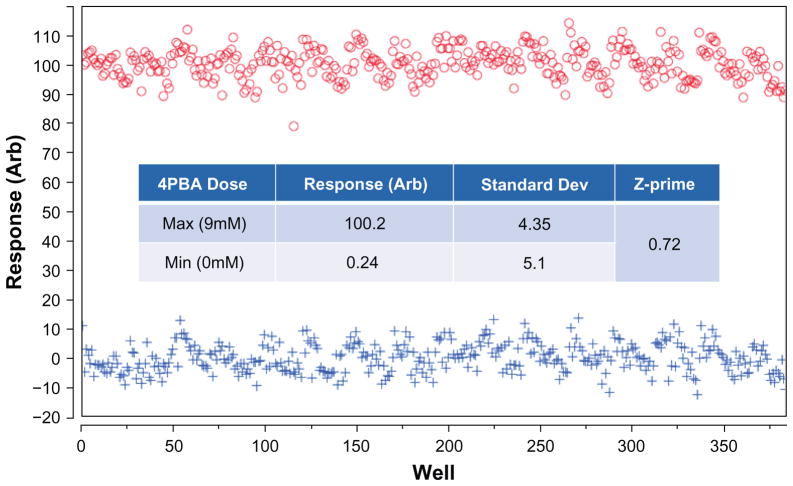
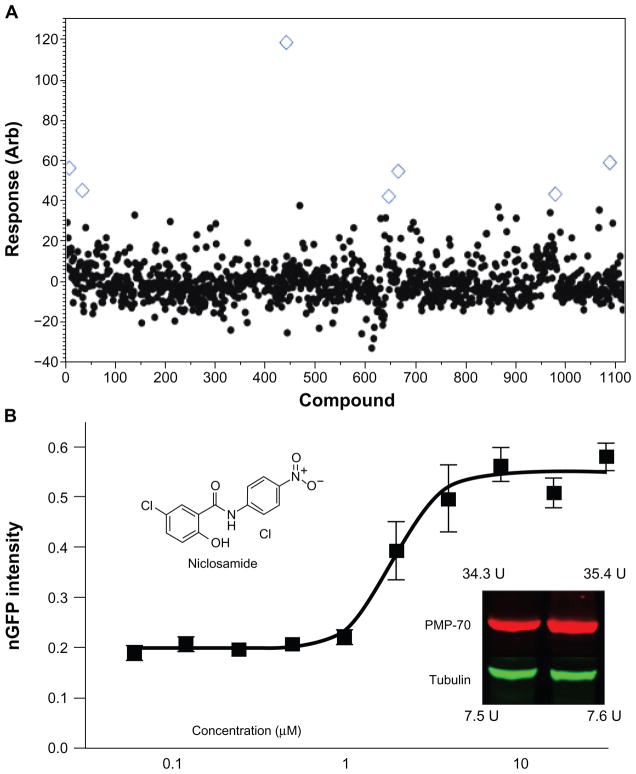
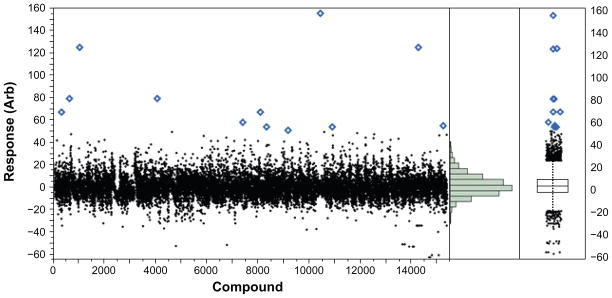
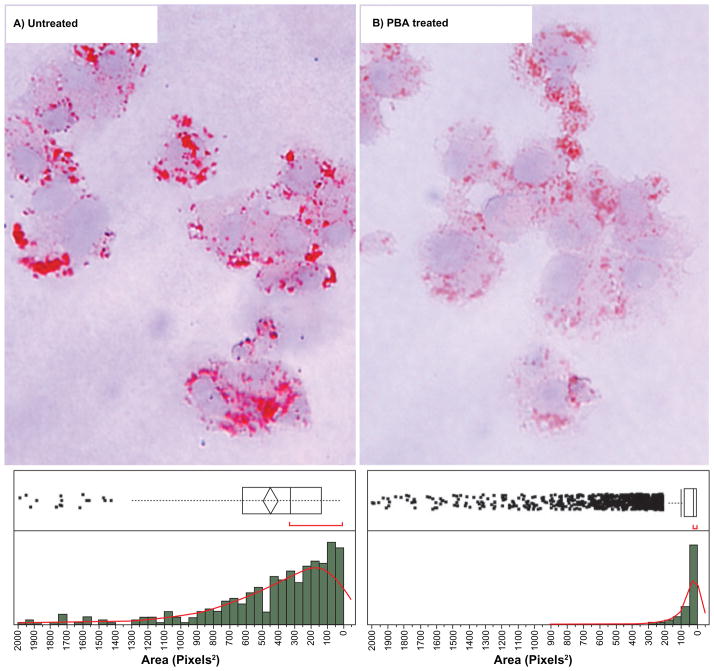
Peroxisomes are ubiquitous cellular organelles that perform vital functions including fatty acid beta-oxidation, plasmalogen synthesis, and detoxification of harmful oxidative species. In rodents numerous compounds that increase peroxisome biogenesis also alleviate metabolic syndrome (MetS)/type 2 diabetes (T2D) symptoms. However, compounds that increase peroxisome biogenesis in rodents largely do not increase peroxisome biogenesis in humans. We designed a novel genetically encoded high throughput screening (HTS) high content assay to identify small molecule compounds that function as peroxisome proliferators in human cells. From this assay we have confirmed that 4-phenylbutyrate (PBA), a PPAR independent peroxisome proliferator and chemical chaperone, increases peroxisome proliferation in human cells and serves as a positive control for our screen. We performed a small pilot and larger 15,000 compound production screen with an overall Z' factor of 0.74 for 384-well plate format, providing a valuable screening tool for identifying peroxisome modulator compounds. From this screen we have identified 4 existing drugs and 10 novel compounds, some with common scaffolds 1000X more potent than PBA. It is hoped that these novel compounds may serve as scaffolds for testing for efficacy in alleviating MetS/T2D symptoms both in mouse models and ultimately human disease.
Conflict of interest statement
The authors report no conflict of interest in this work.
Figures
Similar articles
-
PPAR: a mediator of peroxisome proliferator action.Mutat Res. 1995 Dec;333(1-2):101-9. doi: 10.1016/0027-5107(95)00136-0. Mutat Res. 1995. PMID: 8538617 Review.
-
Hydrogen peroxide generation in peroxisome proliferator-induced oncogenesis.Mutat Res. 2000 Mar 17;448(2):159-77. doi: 10.1016/s0027-5107(99)00234-1. Mutat Res. 2000. PMID: 10725470 Review.
-
Peroxisome proliferator-activated receptor-α signaling in hepatocarcinogenesis.Subcell Biochem. 2013;69:77-99. doi: 10.1007/978-94-007-6889-5_5. Subcell Biochem. 2013. PMID: 23821144 Review.
-
Is peroxisome proliferation an obligatory precursor step in the carcinogenicity of di(2-ethylhexyl)phthalate (DEHP)?Environ Health Perspect. 2001 May;109(5):437-42. doi: 10.1289/ehp.01109437. Environ Health Perspect. 2001. PMID: 11401753 Free PMC article. Review.
-
Hepatic peroxisome proliferation in rodents and its significance for humans.Food Chem Toxicol. 1993 Nov;31(11):857-907. doi: 10.1016/0278-6915(93)90225-n. Food Chem Toxicol. 1993. PMID: 8258416 Review.
Cited by
-
Pexophagy: the selective degradation of peroxisomes.Int J Cell Biol. 2012;2012:512721. doi: 10.1155/2012/512721. Epub 2012 Mar 27. Int J Cell Biol. 2012. PMID: 22536249 Free PMC article.
-
Development and Implementation of a High Throughput Screen for the Human Sperm-Specific Isoform of Glyceraldehyde 3-Phosphate Dehydrogenase (GAPDHS).Curr Chem Genomics. 2011;5:30-41. doi: 10.2174/1875397301105010030. Epub 2011 Jul 4. Curr Chem Genomics. 2011. PMID: 21760877 Free PMC article.
-
N-substituted phenylbenzamides of the niclosamide chemotype attenuate obesity related changes in high fat diet fed mice.PLoS One. 2018 Oct 25;13(10):e0204605. doi: 10.1371/journal.pone.0204605. eCollection 2018. PLoS One. 2018. PMID: 30359371 Free PMC article.
-
Increasing the Content of High-Content Screening: An Overview.J Biomol Screen. 2014 Jun;19(5):640-50. doi: 10.1177/1087057114528537. Epub 2014 Apr 7. J Biomol Screen. 2014. PMID: 24710339 Free PMC article. Review.
-
Peroxisome Plasticity at the Virus-Host Interface.Trends Microbiol. 2019 Nov;27(11):906-914. doi: 10.1016/j.tim.2019.06.006. Epub 2019 Jul 19. Trends Microbiol. 2019. PMID: 31331665 Free PMC article. Review.
References
-
- Heymans HS, Schutgens RB, Tan R, et al. Severe plasmalogen deficiency in tissues of infants without peroxisomes (Zellweger syndrome) Nature. 1983;306(5938):69–70. - PubMed
-
- Shimozawa N, Tsukamoto T, Suzuki Y, et al. A human gene responsible for Zellweger syndrome that affects peroxisome assembly. Science. 1992;255(5048):1132–1134. - PubMed
-
- Song S. The role of increased liver triglyceride content: a culprit of diabetic hyperglycaemia? Diabetes Metab Res Rev. 2002;18(1):5–12. - PubMed
-
- Boden G. Fatty acid-induced inflammation and insulin resistance in skeletal muscle and liver. Curr Diab Rep. 2006;6(3):177–181. - PubMed
-
- Reddy JK, Krishnakantha TP. Hepatic peroxisome proliferation: induction by two novel compounds structurally unrelated to clofibrate. Science. 1975;190(4216):787–789. - PubMed
Grants and funding
LinkOut - more resources
Full Text Sources
Other Literature Sources
Research Materials