

Combining Areal and Point Data in Geostatistical Interpolation: Applications to Soil Science and Medical Geography
- PMID: 21132098
- PMCID: PMC2995922
- DOI: 10.1007/s11004-010-9286-5
Combining Areal and Point Data in Geostatistical Interpolation: Applications to Soil Science and Medical Geography
Abstract
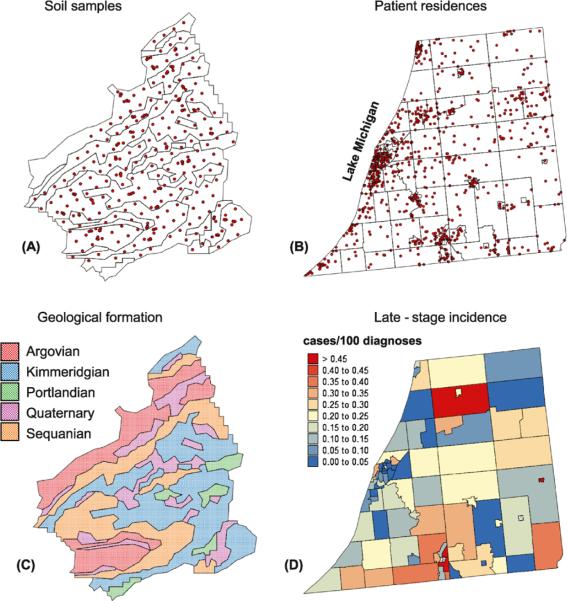
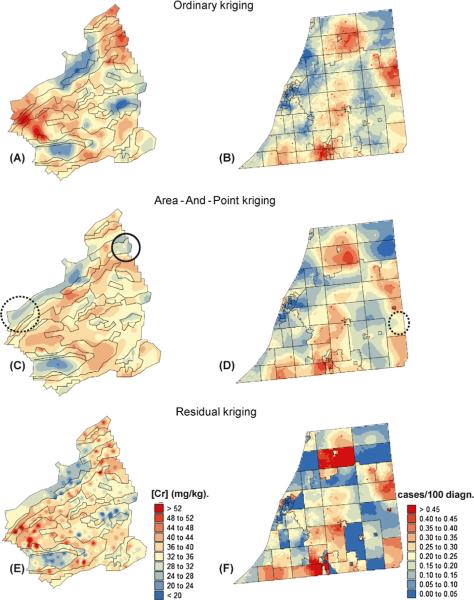
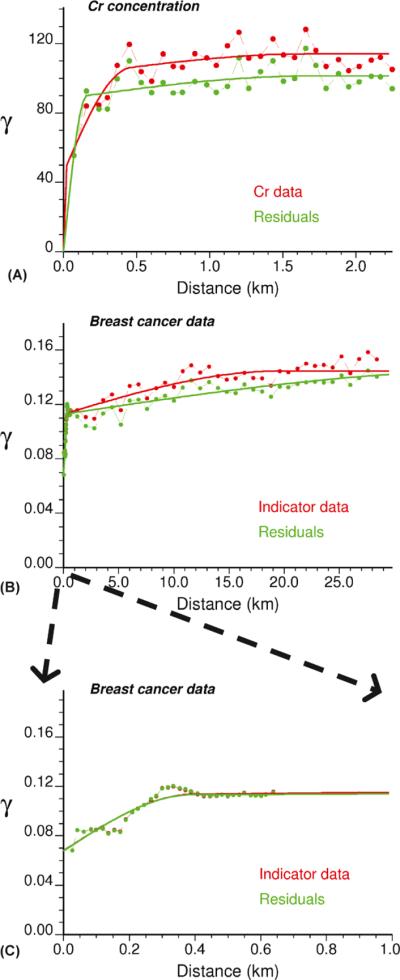
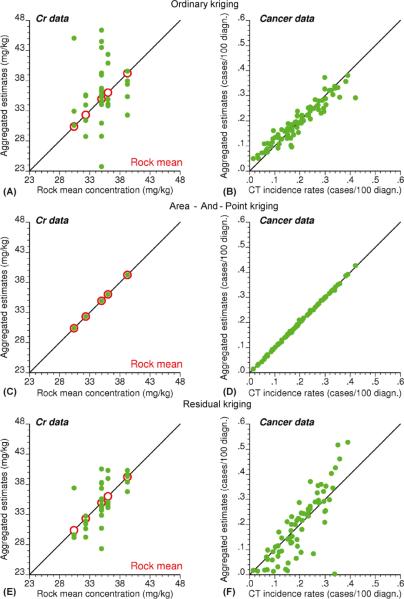
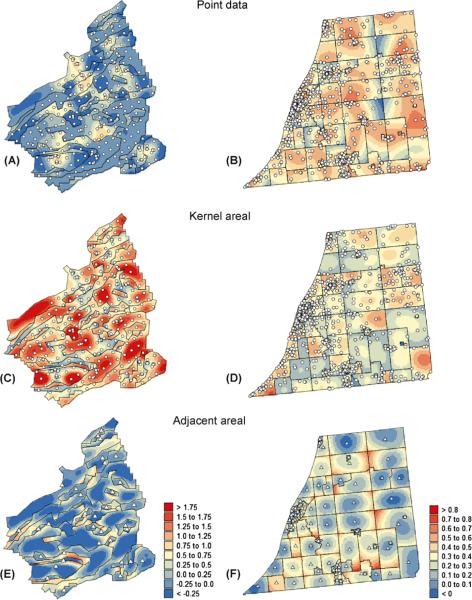
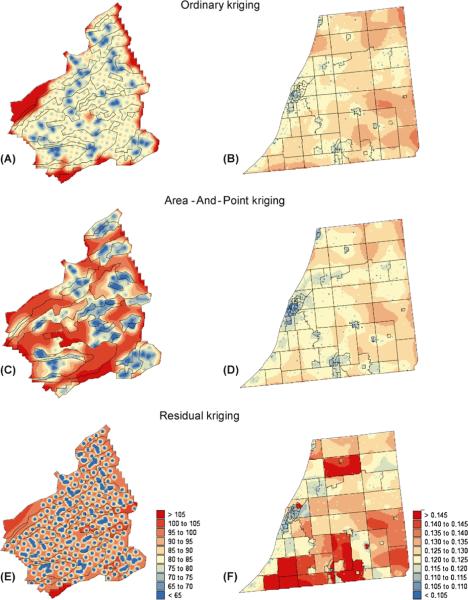
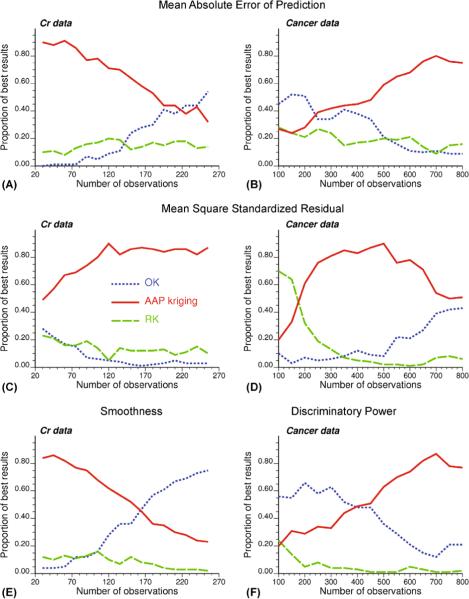
A common issue in spatial interpolation is the combination of data measured over different spatial supports. For example, information available for mapping disease risk typically includes point data (e.g. patients' and controls' residence) and aggregated data (e.g. socio-demographic and economic attributes recorded at the census track level). Similarly, soil measurements at discrete locations in the field are often supplemented with choropleth maps (e.g. soil or geological maps) that model the spatial distribution of soil attributes as the juxtaposition of polygons (areas) with constant values. This paper presents a general formulation of kriging that allows the combination of both point and areal data through the use of area-to-area, area-to-point, and point-to-point covariances in the kriging system. The procedure is illustrated using two data sets: (1) geological map and heavy metal concentrations recorded in the topsoil of the Swiss Jura, and (2) incidence rates of late-stage breast cancer diagnosis per census tract and location of patient residences for three counties in Michigan. In the second case, the kriging system includes an error variance term derived according to the binomial distribution to account for varying degree of reliability of incidence rates depending on the total number of cases recorded in those tracts. Except under the binomial kriging framework, area-and-point (AAP) kriging ensures the coherence of the prediction so that the average of interpolated values within each mapping unit is equal to the original areal datum. The relationships between binomial kriging, Poisson kriging, and indicator kriging are discussed under different scenarios for the population size and spatial support. Sensitivity analysis demonstrates the smaller smoothing and greater prediction accuracy of the new procedure over ordinary and traditional residual kriging based on the assumption that the local mean is constant within each mapping unit.
Figures
Similar articles
-
A coherent geostatistical approach for combining choropleth map and field data in the spatial interpolation of soil properties.Eur J Soil Sci. 2011 Jun;62(3):371-380. doi: 10.1111/j.1365-2389.2011.01368.x. Eur J Soil Sci. 2011. PMID: 22308075 Free PMC article.
-
Geostatistical analysis of disease data: accounting for spatial support and population density in the isopleth mapping of cancer mortality risk using area-to-point Poisson kriging.Int J Health Geogr. 2006 Nov 30;5:52. doi: 10.1186/1476-072X-5-52. Int J Health Geogr. 2006. PMID: 17137504 Free PMC article.
-
Kriging and Semivariogram Deconvolution in the Presence of Irregular Geographical Units.Math Geol. 2008;40(1):101-128. Math Geol. 2008. PMID: 18725997 Free PMC article.
-
How does Poisson kriging compare to the popular BYM model for mapping disease risks?Int J Health Geogr. 2008 Feb 4;7:6. doi: 10.1186/1476-072X-7-6. Int J Health Geogr. 2008. PMID: 18248676 Free PMC article.
-
Folic acid supplementation and malaria susceptibility and severity among people taking antifolate antimalarial drugs in endemic areas.Cochrane Database Syst Rev. 2022 Feb 1;2(2022):CD014217. doi: 10.1002/14651858.CD014217. Cochrane Database Syst Rev. 2022. PMID: 36321557 Free PMC article.
Cited by
-
Disaggregation of legacy soil data using area to point kriging for mapping soil organic carbon at the regional scale.Geoderma. 2012 Jan 15;170:347-358. doi: 10.1016/j.geoderma.2011.10.007. Geoderma. 2012. PMID: 25729090 Free PMC article.
-
Trend and change-point detection analyses of rainfall and temperature over the Awash River basin of Ethiopia.Heliyon. 2021 Sep 20;7(9):e08024. doi: 10.1016/j.heliyon.2021.e08024. eCollection 2021 Sep. Heliyon. 2021. PMID: 34589633 Free PMC article.
-
Integrative Spatial Data Analytics for Public Health Studies of New York State.AMIA Annu Symp Proc. 2017 Feb 10;2016:391-400. eCollection 2016. AMIA Annu Symp Proc. 2017. PMID: 28269834 Free PMC article.
-
From Natural Resources Evaluation to Spatial Epidemiology: 25 Years in the Making.Math Geosci. 2021 Feb;53(2):239-266. doi: 10.1007/s11004-020-09886-x. Epub 2020 Aug 28. Math Geosci. 2021. PMID: 33767799 Free PMC article.
-
Spatiotemporal Imputation of MAIAC AOD Using Deep Learning with Downscaling.Remote Sens Environ. 2020 Feb;237:111584. doi: 10.1016/j.rse.2019.111584. Epub 2019 Dec 10. Remote Sens Environ. 2020. PMID: 32158056 Free PMC article.
References
-
- Atteia O, Dubois J-P, Webster R. Geostatistical analysis of soil contamination in the Swiss Jura. Environ Pollut. 1994;86:315–327. - PubMed
-
- Barry J, Breen N. The importance of place of residence in predicting late-stage diagnosis of breast or cervical cancer. Heal Place. 2005;11:15–29. - PubMed
-
- Best NG, Richardson S, Thomson A. A comparison of Bayesian spatial models for disease mapping. Stat Meth Med Res. 2005;14:35–59. - PubMed
-
- Goovaerts P. Geostatistics for natural resources evaluation. Oxford University Press; New York: 1997.
Grants and funding
LinkOut - more resources
Full Text Sources
Miscellaneous